19. Achievement Test Scores The data shown represent the scores on a national achievement test for a group of 10th-grade students. Find the approximate percentile ranks of these scores by constructing a percentile graph. а. 220 d. 280 b. 245 e. 300 C. 276 Score Frequency 196.5-217.5 217.5-238.5 17 238.5-259.5 22 259.5-280.5 48 280.5-301.5 22 301.5-322.5 TO For the same data, find the approximate scores that cor- respond to these percentiles. f. 15th i. 65th 8. 29th h. 43rd j. 80th
19. Achievement Test Scores The data shown represent the scores on a national achievement test for a group of 10th-grade students. Find the approximate percentile ranks of these scores by constructing a percentile graph. а. 220 d. 280 b. 245 e. 300 C. 276 Score Frequency 196.5-217.5 217.5-238.5 17 238.5-259.5 22 259.5-280.5 48 280.5-301.5 22 301.5-322.5 TO For the same data, find the approximate scores that cor- respond to these percentiles. f. 15th i. 65th 8. 29th h. 43rd j. 80th

Glencoe Algebra 1, Student Edition, 9780079039897, 0079039898, 2018
18th Edition
ISBN:9780079039897
Author:Carter
Publisher:Carter
Chapter10: Statistics
Section10.6: Summarizing Categorical Data
Problem 42PFA

Related questions

Question
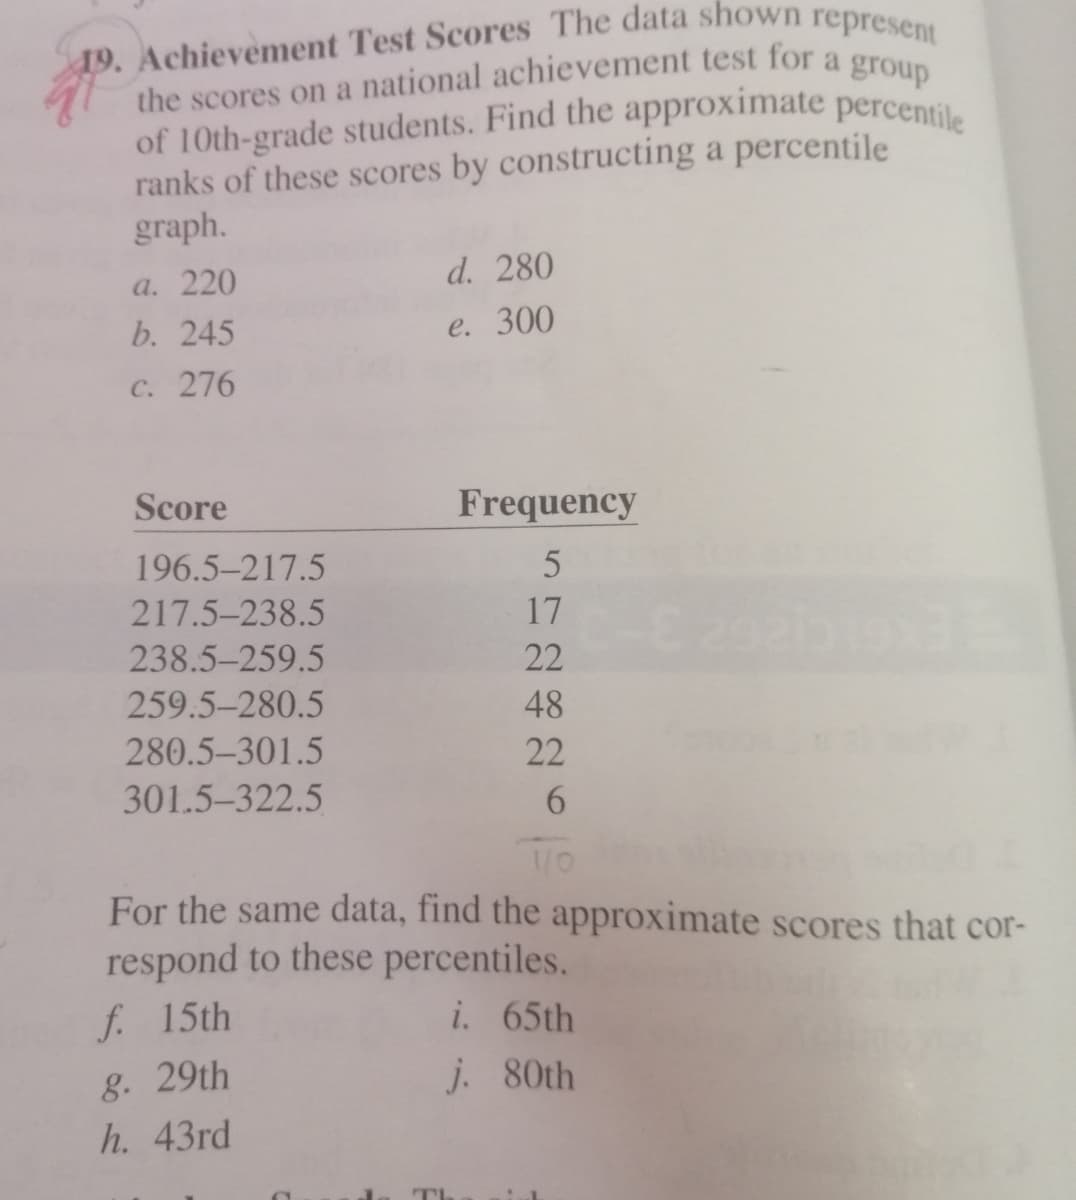
Transcribed Image Text:19. Achievement Test Scores The data shown represent
the scores on a national achievement test for a group
of 10th-grade students. Find the approximate percentile
of 10th-grade students. Find the approximate percentile
ranks of these scores by constructing a percentile
graph.
а. 220
d. 280
b. 245
e. 300
C. 276
Score
Frequency
196.5-217.5
217.5-238.5
17
238.5-259.5
22
259.5-280.5
48
280.5-301.5
22
301.5-322.5
For the same data, find the approximate scores that cor-
respond to these percentiles.
f. 15th
i. 65th
8. 29th
h. 43rd
j. 80th
Expert Solution
This question has been solved!
Explore an expertly crafted, step-by-step solution for a thorough understanding of key concepts.

This is a popular solution!

Trending now
This is a popular solution!

Step by step
Solved in 5 steps

Knowledge Booster


Learn more about
Need a deep-dive on the concept behind this application? Look no further. Learn more about this topic, statistics and related others by exploring similar questions and additional content below.Recommended textbooks for you
Glencoe Algebra 1, Student Edition, 9780079039897…
Algebra
ISBN:
9780079039897
Author:
Carter
Publisher:
McGraw Hill
Glencoe Algebra 1, Student Edition, 9780079039897…
Algebra
ISBN:
9780079039897
Author:
Carter
Publisher:
McGraw Hill