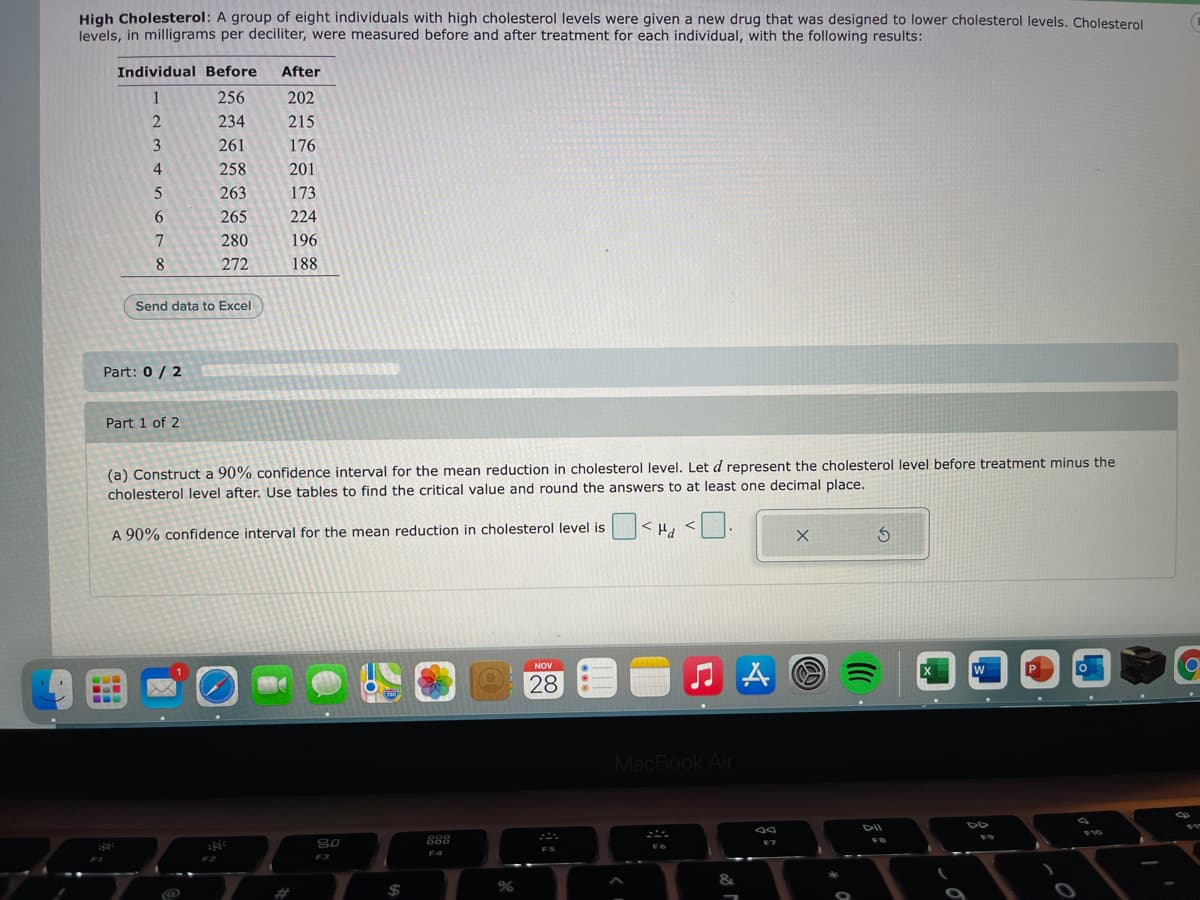
High Cholesterol: A group of eight individuals with high cholesterol levels were given a new drug that was designed to lower cholesterol levels. Cholesterol levels, in milligrams per deciliter, were measured before and after treatment for each individual, with the following results: Individual Before After 1 256 202 2 234 215 3 261 176 258 201 263 173 265 224 7 280 196 8 272 188 Send data to Excel Part: 0 / 2 Part 1 of 2 cholesterol level before treatment minus the (a) Construct a 90% confidence interval for the mean reduction in cholesterol level. Let d represent cholesterol level after. Use tables to find the critical value and round the answers to at least one decimal place. |
High Cholesterol: A group of eight individuals with high cholesterol levels were given a new drug that was designed to lower cholesterol levels. Cholesterol levels, in milligrams per deciliter, were measured before and after treatment for each individual, with the following results: Individual Before After 1 256 202 2 234 215 3 261 176 258 201 263 173 265 224 7 280 196 8 272 188 Send data to Excel Part: 0 / 2 Part 1 of 2 cholesterol level before treatment minus the (a) Construct a 90% confidence interval for the mean reduction in cholesterol level. Let d represent cholesterol level after. Use tables to find the critical value and round the answers to at least one decimal place. |

Functions and Change: A Modeling Approach to College Algebra (MindTap Course List)
6th Edition
ISBN:9781337111348
Author:Bruce Crauder, Benny Evans, Alan Noell
Publisher:Bruce Crauder, Benny Evans, Alan Noell
Chapter5: A Survey Of Other Common Functions
Section5.3: Modeling Data With Power Functions
Problem 6E: Urban Travel Times Population of cities and driving times are related, as shown in the accompanying...

Related questions
Question
Transcribed Image Text:High Cholesterol: A group of eight individuals with high cholesterol levels were given a new drug that was designed to lower cholesterol levels. Cholesterol
levels, in milligrams per deciliter, were measured before and after treatment for each individual, with the following results:
Individual Before
After
1
256
202
234
215
3
261
176
258
201
263
173
265
224
7
280
196
8
272
188
Send data to Excel
Part: 0 / 2
Part 1 of 2
(a) Construct a 90% confidence interval for the mean reduction in cholesterol level. Let d represent the cholesterol level before treatment minus the
cholesterol level after. Use tables to find the critical value and round the answers to at least one decimal place.
A 90% confidence interval for the mean reduction in cholesterol level is
NOV
1
28
MacBook Air
DII
80
888
FB
F7
FS
F4
Expert Solution
This question has been solved!
Explore an expertly crafted, step-by-step solution for a thorough understanding of key concepts.

This is a popular solution!

Trending now
This is a popular solution!

Step by step
Solved in 2 steps with 5 images

Recommended textbooks for you
Functions and Change: A Modeling Approach to Coll…
Algebra
ISBN:
9781337111348
Author:
Bruce Crauder, Benny Evans, Alan Noell
Publisher:
Cengage Learning

Holt Mcdougal Larson Pre-algebra: Student Edition…
Algebra
ISBN:
9780547587776
Author:
HOLT MCDOUGAL
Publisher:
HOLT MCDOUGAL

Glencoe Algebra 1, Student Edition, 9780079039897…
Algebra
ISBN:
9780079039897
Author:
Carter
Publisher:
McGraw Hill
Functions and Change: A Modeling Approach to Coll…
Algebra
ISBN:
9781337111348
Author:
Bruce Crauder, Benny Evans, Alan Noell
Publisher:
Cengage Learning
Holt Mcdougal Larson Pre-algebra: Student Edition…
Algebra
ISBN:
9780547587776
Author:
HOLT MCDOUGAL
Publisher:
HOLT MCDOUGAL
Glencoe Algebra 1, Student Edition, 9780079039897…
Algebra
ISBN:
9780079039897
Author:
Carter
Publisher:
McGraw Hill