=== 2 LI Conditional Formatting v E Insert v Calibri (Body) 12 v A A General E Format as Table v X Delete v en v A v Paste BIUV $ v % 9 Editing Analyze Data Create and Share Adobe PDF Cell Styles v E Format v T20 fx A B D E F G K L. M P R U V X Y Sample i Brand 1 Brand 2 1 99.11 110.65 A major retailer wants to choose between two equally-priced brands of compact fluorescent lamps. To do this, they take a random sample of 100 lamps of each brand. The lifetimes, measured in hours, of the lamps are shown on this sheet. To make the decision, they must first determine whether the underlying population variances are equal. Assume lifetimes follow normal distribution. Use a significance level of 5%. 99.45 92.24 3 98.39 96.63 4 97.07 99.45 99.97 102.55 a) State the null and alternate hypotheses. b) What is the value of the test statistic? c) What is the critical value of the test? d) What is your conclusion? Explain it in the context of the problem. 6 100.06 98.2 6. 109.60 96.53 98.13 104.64 9 107.73 88.03 10 95.58 96.87 2 3 11 96.98 96.02 12 100.47 97.33 38 92.23 101.57 64 102.03 99.62 4 13 101.23 105.14 39 99.87 105.21 65 99 100.96 90 101.17 100.65 5 14 100.39 99.86 40 98.7 92.84 66 101.36 99.05 95.72 91 96.65 96.33 6 15 106.07 93.81 41 97.7 99.89 67 98.75 92 100.27 89.44 16 98.02 92.26 42 102.67 94.24 68 99.03 90.28 93 98.99 103.91 8 17 100.26 103.67 43 100.3 96.43 69 98.75 88.87 94 103.24 103.96 18 102.48 93.61 44 101.76 93.64 70 94.8 110.15 95 100.29 87.99 19 97.88 97.28 45 100.11 97.44 71 101.26 113.99 96 93.25 98.86 20 102.58 102.51 46 103.05 109.93 72 99.08 97.37 97 102.86 96.47 2 3 21 101 106.59 47 100.82 100.20 73 103.6 102.17 98 102.65 101.32 22 97.01 100.90 48 99.94 101.34 74 102.56 95.82 99 102.74 103.46 4 23 103.91 98.67 49 98.89 97.41 75 95.44 104.44 100 98.78 96.70 24 96.23 102.64 50 95.22 109.89 76 98.26 108.21 25 99.84 99.76 51 99.55 107.33 77 95.05 100.28 7 8 9 26 102.49 108.11 52 102.67 95.24 78 100.65 92.43 27 97.8 101.96 53 98.43 91.33 79 99.86 91.92 28 101.1 98.36 54 101.69 102.49 80 105.21 81.47 29 99.51 101.93 55 100.86 106.89 81 101.26 92.58 1 98.86 99.19 30 99.49 112.25 56 103.68 82 103.88 106.49 2 31 101.63 105.35 57 103.97 83 106.71 102.46 3 32 104.85 100.95 58 95.9 93.47 84 100.07 92.72 4 33 99.69 85.00 59 101.85 94.93 85 99.3 101.97 34 97.68 95.50 60 96.05 101.94 86 103.74 96.85 6 7 8 9 35 100.31 111.24 61 103.36 98.81 87 99.6 96.92 36 95.29 109.34 62 102.31 103.66 88 104.24 103.56 37 101 99.67 63 103.15 102.03 89 100.59 87.85 Sheet1 國
=== 2 LI Conditional Formatting v E Insert v Calibri (Body) 12 v A A General E Format as Table v X Delete v en v A v Paste BIUV $ v % 9 Editing Analyze Data Create and Share Adobe PDF Cell Styles v E Format v T20 fx A B D E F G K L. M P R U V X Y Sample i Brand 1 Brand 2 1 99.11 110.65 A major retailer wants to choose between two equally-priced brands of compact fluorescent lamps. To do this, they take a random sample of 100 lamps of each brand. The lifetimes, measured in hours, of the lamps are shown on this sheet. To make the decision, they must first determine whether the underlying population variances are equal. Assume lifetimes follow normal distribution. Use a significance level of 5%. 99.45 92.24 3 98.39 96.63 4 97.07 99.45 99.97 102.55 a) State the null and alternate hypotheses. b) What is the value of the test statistic? c) What is the critical value of the test? d) What is your conclusion? Explain it in the context of the problem. 6 100.06 98.2 6. 109.60 96.53 98.13 104.64 9 107.73 88.03 10 95.58 96.87 2 3 11 96.98 96.02 12 100.47 97.33 38 92.23 101.57 64 102.03 99.62 4 13 101.23 105.14 39 99.87 105.21 65 99 100.96 90 101.17 100.65 5 14 100.39 99.86 40 98.7 92.84 66 101.36 99.05 95.72 91 96.65 96.33 6 15 106.07 93.81 41 97.7 99.89 67 98.75 92 100.27 89.44 16 98.02 92.26 42 102.67 94.24 68 99.03 90.28 93 98.99 103.91 8 17 100.26 103.67 43 100.3 96.43 69 98.75 88.87 94 103.24 103.96 18 102.48 93.61 44 101.76 93.64 70 94.8 110.15 95 100.29 87.99 19 97.88 97.28 45 100.11 97.44 71 101.26 113.99 96 93.25 98.86 20 102.58 102.51 46 103.05 109.93 72 99.08 97.37 97 102.86 96.47 2 3 21 101 106.59 47 100.82 100.20 73 103.6 102.17 98 102.65 101.32 22 97.01 100.90 48 99.94 101.34 74 102.56 95.82 99 102.74 103.46 4 23 103.91 98.67 49 98.89 97.41 75 95.44 104.44 100 98.78 96.70 24 96.23 102.64 50 95.22 109.89 76 98.26 108.21 25 99.84 99.76 51 99.55 107.33 77 95.05 100.28 7 8 9 26 102.49 108.11 52 102.67 95.24 78 100.65 92.43 27 97.8 101.96 53 98.43 91.33 79 99.86 91.92 28 101.1 98.36 54 101.69 102.49 80 105.21 81.47 29 99.51 101.93 55 100.86 106.89 81 101.26 92.58 1 98.86 99.19 30 99.49 112.25 56 103.68 82 103.88 106.49 2 31 101.63 105.35 57 103.97 83 106.71 102.46 3 32 104.85 100.95 58 95.9 93.47 84 100.07 92.72 4 33 99.69 85.00 59 101.85 94.93 85 99.3 101.97 34 97.68 95.50 60 96.05 101.94 86 103.74 96.85 6 7 8 9 35 100.31 111.24 61 103.36 98.81 87 99.6 96.92 36 95.29 109.34 62 102.31 103.66 88 104.24 103.56 37 101 99.67 63 103.15 102.03 89 100.59 87.85 Sheet1 國

MATLAB: An Introduction with Applications
6th Edition
ISBN:9781119256830
Author:Amos Gilat
Publisher:Amos Gilat
Chapter1: Starting With Matlab
Section: Chapter Questions
Problem 1P

Related questions

Concept explainers
Equations and Inequations
Equations and inequalities describe the relationship between two mathematical expressions.
Linear Functions
A linear function can just be a constant, or it can be the constant multiplied with the variable like x or y. If the variables are of the form, x2, x1/2 or y2 it is not linear. The exponent over the variables should always be 1.
Question
100%
Please provide excel stp by step formula to better understand. Thanks.
Transcribed Image Text:AutoSave
OFF
Book1
...
Page Layout
Formulas
Review
View
Acrobat O Tell me
2 Share
O Comments
Home
Insert
Draw
Data
Calibri (Body)
- A A
General
H Conditional Formatting v
A Insert v
12
LG
Paste
E Format as Table v
bX Delete v
I U v
A v
A v
$ v % 9
.00
C00 20
Analyze
Data
Create and Share
Adobe PDF
В
Editing
E Cell Styles v
H Format v
T20
fx
A
В
D
F
G
H
K
M
Q.
R
S
U
V
X
Y
1
Sample# Brand 1 Brand 2
2
1
99.11
110.65
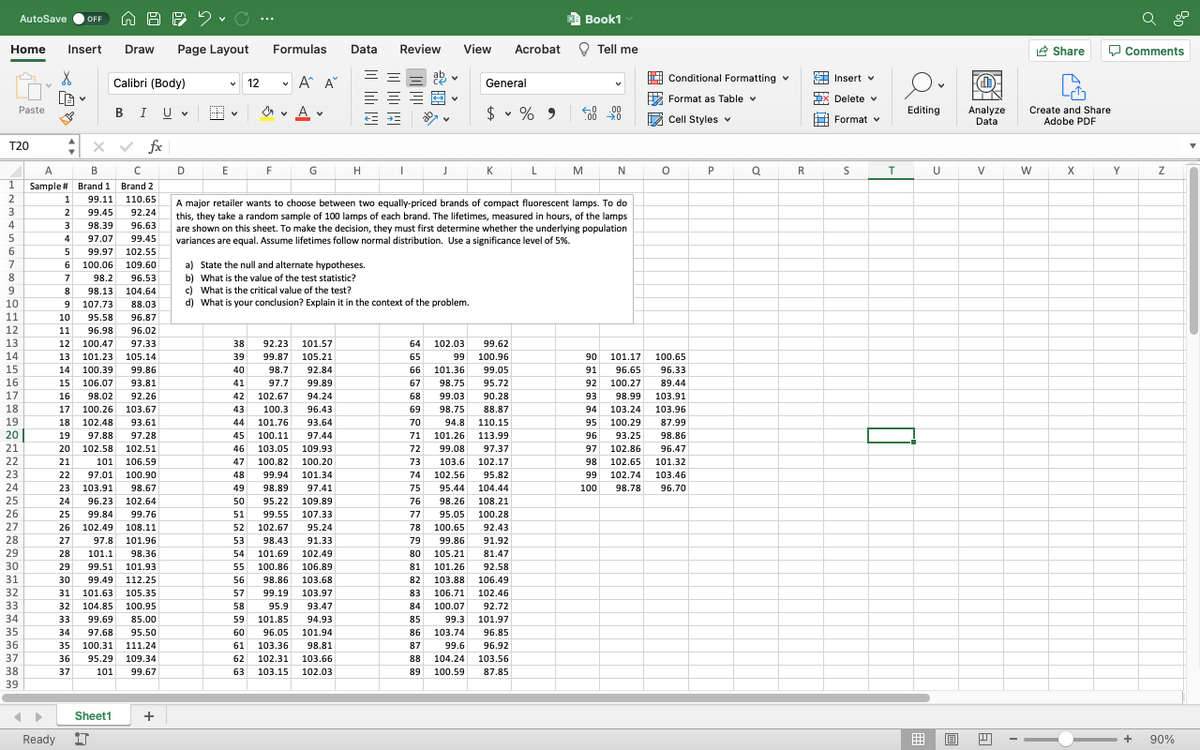
A major retailer wants to choose between two equally-priced brands of compact fluorescent lamps. To do
this, they take a random sample of 100 lamps of each brand. The lifetimes, measured in hours, of the lamps
are shown on this sheet. To make the decision, they must first determine whether the underlying population
variances are equal. Assume lifetimes follow normal distribution. Use a significance level of 5%.
3
2
99.45
92.24
4
3
98.39
96.63
4
97.07
99.45
6
5
99.97
102.55
7
6 100.06
a) State the null and alternate hypotheses.
b) What is the value of the test statistic?
c) What is the critical value of the test?
d) What is your conclusion? Explain it in the context of the problem.
6.
109.60
8
7
98.2
96.53
9
8
98.13
104.64
10
9
107.73
88.03
11
10
95.58
96.87
12
11
96.98
96.02
13
12
100.47
97.33
38
92.23
101.57
64
102.03
99.62
14
13
101.23
105.14
39
99.87
105.21
65
99
100.96
90
101.17
100.65
15
14
100.39
99.86
40
98.7
92.84
66
101.36
99.05
91
96.65
96.33
16
15
106.07
93.81
41
97.7
99.89
67
98.75
95.72
92
100.27
89.44
17
16
98.02
92.26
42
102.67
94.24
68
99.03
90.28
93
98.99
103.91
18
17
100.26
103.67
43
100.3
96.43
69
98.75
88.87
94
103.24
103.96
19
18
102.48
93.61
44
101.76
93.64
70
94.8
110.15
95
100.29
87.99
20
19
97.88
97.28
45
100.11
97.44
71
101.26
113.99
96
93.25
98.86
21
20
102.58
102.51
46
103.05
109.93
72
99.08
97.37
97
102.86
96.47
22
21
101
106.59
47
100.82
100.20
73
103,6
102.17
98
102.65
101.32
23
22
97.01
100.90
48
99.94
101.34
74
102,56
95.82
99
102.74
103.46
24
23 103.91
98.67
49
98.89
97.41
75
95.44
104.44
100
98.78
96.70
25
24
96.23
102.64
50
95.22
109.89
76
98.26
108.21
26
25
99.84
99.76
51
99.55
107.33
77
95.05
100.28
27
26
102.49
108.11
52
102.67
95.24
78
100.65
92.43
28
29
27
97.8
101.96
53
98.43
91.33
79
99.86
91.92
28
101.1
98.36
54
101.69
102.49
80
105.21
81.47
30
29
99.51
101.93
55
100.86
106.89
81
101.26
92.58
31
30
99.49 112.25
56
98.86
103.68
82
103.88
106.49
32
31
101.63
105.35
57
99.19
103.97
83
106.71
102.46
33
32
104.85
100.95
58
95.9
93.47
84
100.07
92.72
34
33
99.69
85.00
59
101.85
94.93
85
99.3
101.97
35
34
97.68
95.50
60
96.05
101.94
86
103.74
96.85
36
35
100.31
111.24
61
103.36
98.81
87
99.6
96.92
37
36
95.29
109.34
62
102.31
103.66
88
104.24
103.56
38
37
101
99.67
63
103.15
102.03
89
100.59
87.85
39
Sheet1
Ready
90%
Expert Solution
This question has been solved!
Explore an expertly crafted, step-by-step solution for a thorough understanding of key concepts.

This is a popular solution!

Trending now
This is a popular solution!

Step by step
Solved in 6 steps

Knowledge Booster


Learn more about
Need a deep-dive on the concept behind this application? Look no further. Learn more about this topic, statistics and related others by exploring similar questions and additional content below.Recommended textbooks for you
MATLAB: An Introduction with Applications
Statistics
ISBN:
9781119256830
Author:
Amos Gilat
Publisher:
John Wiley & Sons Inc

Probability and Statistics for Engineering and th…
Statistics
ISBN:
9781305251809
Author:
Jay L. Devore
Publisher:
Cengage Learning

Statistics for The Behavioral Sciences (MindTap C…
Statistics
ISBN:
9781305504912
Author:
Frederick J Gravetter, Larry B. Wallnau
Publisher:
Cengage Learning
MATLAB: An Introduction with Applications
Statistics
ISBN:
9781119256830
Author:
Amos Gilat
Publisher:
John Wiley & Sons Inc
Probability and Statistics for Engineering and th…
Statistics
ISBN:
9781305251809
Author:
Jay L. Devore
Publisher:
Cengage Learning
Statistics for The Behavioral Sciences (MindTap C…
Statistics
ISBN:
9781305504912
Author:
Frederick J Gravetter, Larry B. Wallnau
Publisher:
Cengage Learning

Elementary Statistics: Picturing the World (7th E…
Statistics
ISBN:
9780134683416
Author:
Ron Larson, Betsy Farber
Publisher:
PEARSON

The Basic Practice of Statistics
Statistics
ISBN:
9781319042578
Author:
David S. Moore, William I. Notz, Michael A. Fligner
Publisher:
W. H. Freeman

Introduction to the Practice of Statistics
Statistics
ISBN:
9781319013387
Author:
David S. Moore, George P. McCabe, Bruce A. Craig
Publisher:
W. H. Freeman