2) The graph below represents various flows that can occur through a sewage treatment plant, with the numbers on the arcs representing the maximum flow in tons of sewage per hour that can be accommodated. a) What is the LP model for this problem? (Objective function and constraints). b) Solve this problem with Analytic Solver. 1 8 10 2 5 3 6 6 6 9 10 9 5 5 6 7 10 5 9 8
2) The graph below represents various flows that can occur through a sewage treatment plant, with the numbers on the arcs representing the maximum flow in tons of sewage per hour that can be accommodated. a) What is the LP model for this problem? (Objective function and constraints). b) Solve this problem with Analytic Solver. 1 8 10 2 5 3 6 6 6 9 10 9 5 5 6 7 10 5 9 8

Practical Management Science
6th Edition
ISBN:9781337406659
Author:WINSTON, Wayne L.
Publisher:WINSTON, Wayne L.
Chapter6: Optimization Models With Integer Variables
Section: Chapter Questions
Problem 72P

Related questions
Question
100%
I need help in formulating the constraints for this problem. So, help with part (a) is all I need.
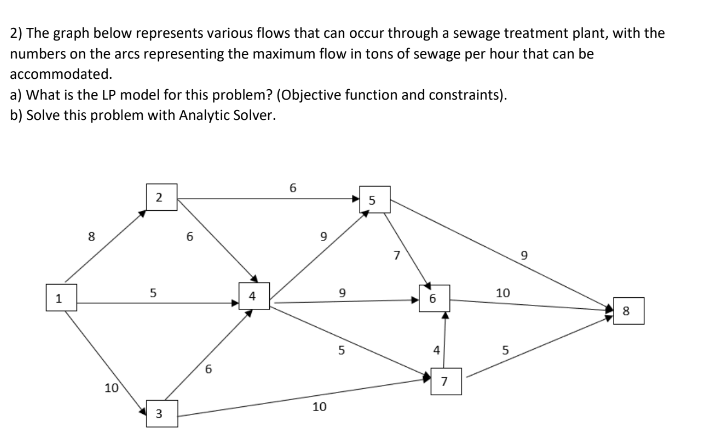
Transcribed Image Text:2) The graph below represents various flows that can occur through a sewage treatment plant, with the
numbers on the arcs representing the maximum flow in tons of sewage per hour that can be
accommodated.
a) What is the LP model for this problem? (Objective function and constraints).
b) Solve this problem with Analytic Solver.
1
8
10
2
5
3
10
6
4
6
10
6
5
5
6
4
7
10
5
9
8
Expert Solution
This question has been solved!
Explore an expertly crafted, step-by-step solution for a thorough understanding of key concepts.

This is a popular solution!

Trending now
This is a popular solution!

Step by step
Solved in 3 steps with 4 images

Recommended textbooks for you
Practical Management Science
Operations Management
ISBN:
9781337406659
Author:
WINSTON, Wayne L.
Publisher:
Cengage,
Practical Management Science
Operations Management
ISBN:
9781337406659
Author:
WINSTON, Wayne L.
Publisher:
Cengage,