2. To determine if there is a difference in the average score per game in basketball for Division 1, Division 2, and Division 3 schools a random sample of ten basketball games per division was obtained. The table below gives the scores for the ten games per division. At the 10% significance, is there a difference in the average score for the three different divisions. DI scores 57 58 62 64 59 63 56 63 58 63 D2 scores 55 57 51 56 49 56 61 55 50 54 D3 scores 50 58 51 55 49 50 55 51 52 47
2. To determine if there is a difference in the average score per game in basketball for Division 1, Division 2, and Division 3 schools a random sample of ten basketball games per division was obtained. The table below gives the scores for the ten games per division. At the 10% significance, is there a difference in the average score for the three different divisions. DI scores 57 58 62 64 59 63 56 63 58 63 D2 scores 55 57 51 56 49 56 61 55 50 54 D3 scores 50 58 51 55 49 50 55 51 52 47

MATLAB: An Introduction with Applications
6th Edition
ISBN:9781119256830
Author:Amos Gilat
Publisher:Amos Gilat
Chapter1: Starting With Matlab
Section: Chapter Questions
Problem 1P

Related questions

Question
Please show all work
Transcribed Image Text:Chapter 9 Review Homework: AR
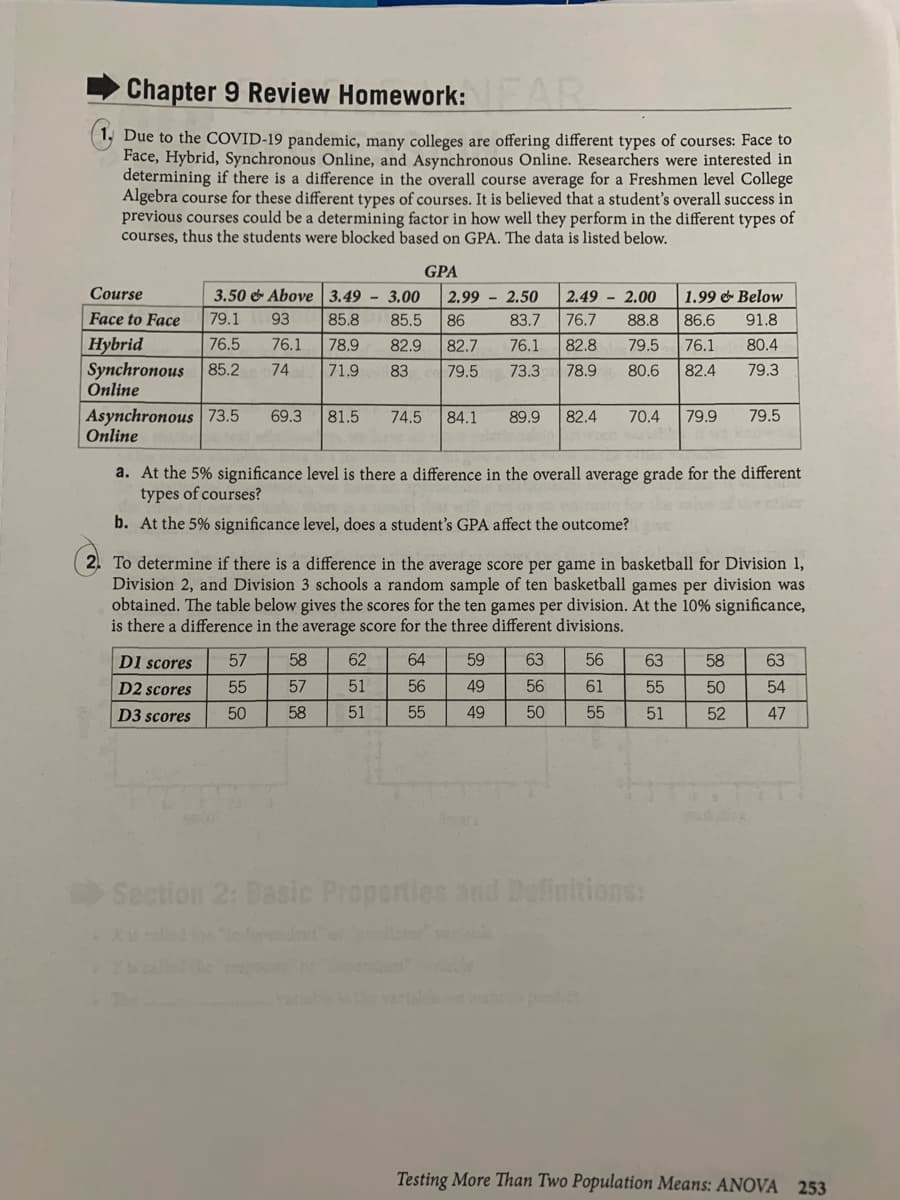
Due to the COVID-19 pandemic, many colleges are offering different types of courses: Face to
Face, Hybrid, Synchronous Online, and Asynchronous Online. Researchers were interested in
determining if there is a difference in the overall course average for a Freshmen level College
Algebra course for these different types of courses. It is believed that a student's overall success in
previous courses could be a determining factor in how well they perform in the different types of
courses, thus the students were blocked based on GPA. The data is listed below.
GPA
Course
3.50 e Above 3.49 - 3.00
2.99 - 2.50
2.49 - 2.00
1.99 e Below
Face to Face
79.1
93
85.8
85.5
86
83.7
76.7
88.8
86.6
91.8
Hybrid
Synchronous 85.2
Online
76.5
76.1
78.9
82.9
82.7
76.1
82.8
79.5
76.1
80.4
74
71.9
83
79.5
73.3
78.9
80.6
82.4
79.3
Asynchronous 73.5
Online
69.3
81.5
74.5
84.1
89.9
82.4
70.4
79.9
79.5
a. At the 5% significance level is there a difference in the overall average grade for the different
types of courses?
b. At the 5% significance level, does a student's GPA affect the outcome?
2. To determine if there is a difference in the average score per game in basketball for Division 1,
Division 2, and Division 3 schools a random sample of ten basketball games per division was
obtained. The table below gives the scores for the ten games per division. At the 10% significance,
is there a difference in the average score for the three different divisions.
DI scores
57
58
62
64
59
63
56
63
58
63
D2 scores
55
57
51
56
49
56
61
55
50
54
D3 scores
50
58
51
55
49
50
55
51
52
47
Section 2: Basic Properties and Definitions:
Testing More Than Two Population Means: ANOVA 253
Expert Solution
This question has been solved!
Explore an expertly crafted, step-by-step solution for a thorough understanding of key concepts.

This is a popular solution!

Trending now
This is a popular solution!

Step by step
Solved in 3 steps with 3 images

Knowledge Booster


Learn more about
Need a deep-dive on the concept behind this application? Look no further. Learn more about this topic, statistics and related others by exploring similar questions and additional content below.Recommended textbooks for you
MATLAB: An Introduction with Applications
Statistics
ISBN:
9781119256830
Author:
Amos Gilat
Publisher:
John Wiley & Sons Inc

Probability and Statistics for Engineering and th…
Statistics
ISBN:
9781305251809
Author:
Jay L. Devore
Publisher:
Cengage Learning

Statistics for The Behavioral Sciences (MindTap C…
Statistics
ISBN:
9781305504912
Author:
Frederick J Gravetter, Larry B. Wallnau
Publisher:
Cengage Learning
MATLAB: An Introduction with Applications
Statistics
ISBN:
9781119256830
Author:
Amos Gilat
Publisher:
John Wiley & Sons Inc
Probability and Statistics for Engineering and th…
Statistics
ISBN:
9781305251809
Author:
Jay L. Devore
Publisher:
Cengage Learning
Statistics for The Behavioral Sciences (MindTap C…
Statistics
ISBN:
9781305504912
Author:
Frederick J Gravetter, Larry B. Wallnau
Publisher:
Cengage Learning

Elementary Statistics: Picturing the World (7th E…
Statistics
ISBN:
9780134683416
Author:
Ron Larson, Betsy Farber
Publisher:
PEARSON

The Basic Practice of Statistics
Statistics
ISBN:
9781319042578
Author:
David S. Moore, William I. Notz, Michael A. Fligner
Publisher:
W. H. Freeman

Introduction to the Practice of Statistics
Statistics
ISBN:
9781319013387
Author:
David S. Moore, George P. McCabe, Bruce A. Craig
Publisher:
W. H. Freeman