2. Usé thè linear regression équation ànd the fóllowing Abs 595 dată and dilution factors för calculating your protein concentrations: SAMPLE ABS 595 DILUTION Calculated FACTOR [protein] (mg/mL) 3.098 CRUDE 0.114 0.119 0.176 10 FLOW THRU 5 PRE DESALTING 3 POST DESALTING 0.157 3
2. Usé thè linear regression équation ànd the fóllowing Abs 595 dată and dilution factors för calculating your protein concentrations: SAMPLE ABS 595 DILUTION Calculated FACTOR [protein] (mg/mL) 3.098 CRUDE 0.114 0.119 0.176 10 FLOW THRU 5 PRE DESALTING 3 POST DESALTING 0.157 3

Chapter12: Spectrochemical Methods
Section: Chapter Questions
Problem 4P

Related questions

Question
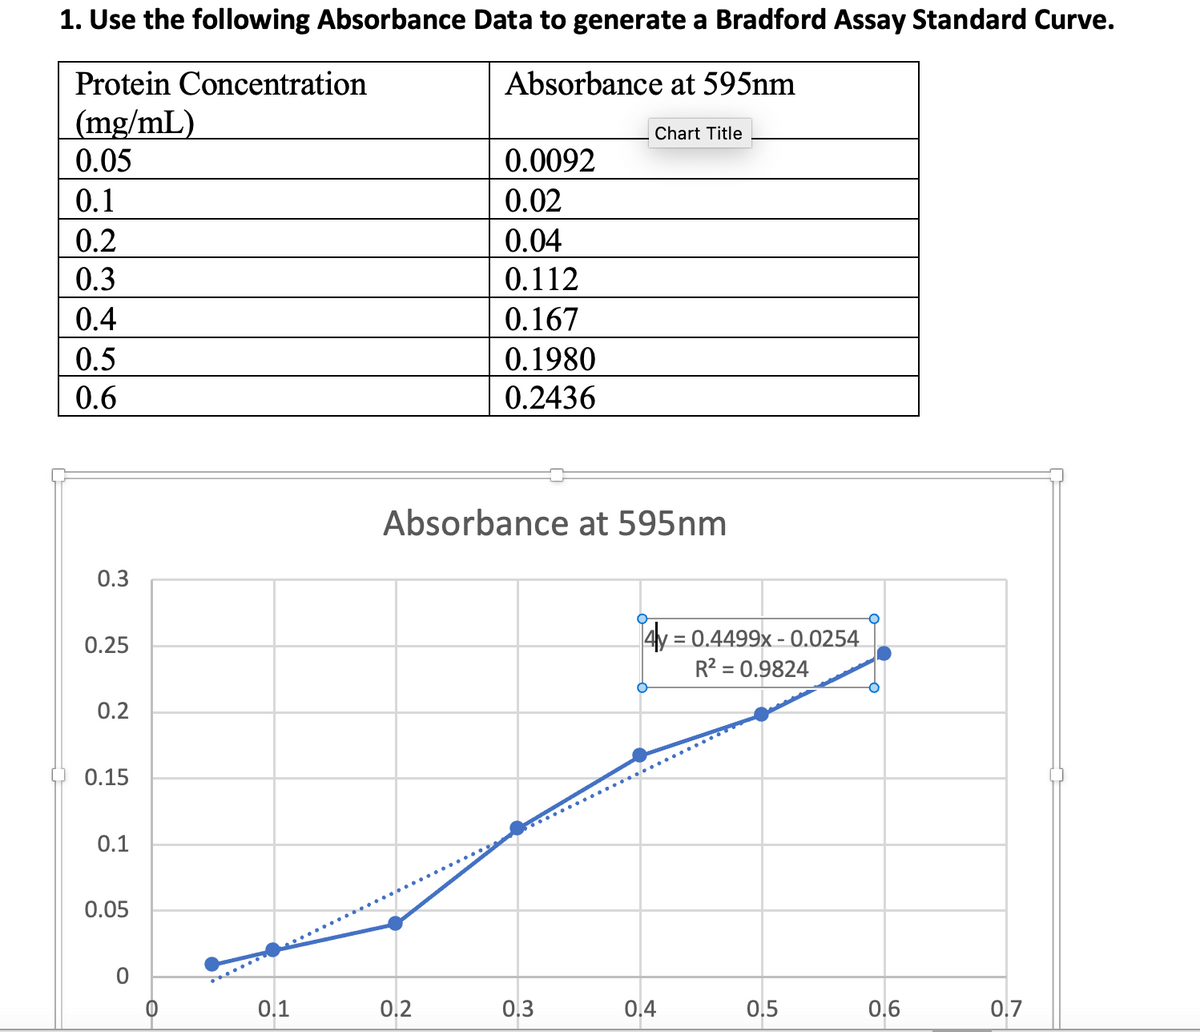
Transcribed Image Text:1. Use the following Absorbance Data to generate a Bradford Assay Standard Curve.
Protein Concentration
Absorbance at 595nm
(mg/mL)
0.05
Chart Title
0.0092
0.1
0.02
0.2
0.04
0.3
0.112
0.4
0.167
0.5
0.1980
0.6
0.2436
Absorbance at 595nm
0.3
4y = 0.4499x - 0.0254
R? = 0.9824
0.25
0.2
0.15
0.1
0.05
0.1
0.2
0,3
0.4
0,5
0.6
0.7
![2. Use the linear regression equation and the following Abs 595 data and dilution factors for
calculating your protein concentrations:
SAMPLE
ABS 595
DILUTION
Calculated
FACTOR
[protein]
(mg/mL)
CRUDE
0.114
10
3.098
FLOW THRU
0.119
5
PRE DESALTING
0.176
3
POST DESALTING
0.157
3
3. Using the protein concentrations that you calculated, determine the volume in ul of each sampl
that would be needed to load 25ug of that sample on an SDS-PAGE. See example in the first row of
the table.
SAMPLE
Volume of
Vol of 4x
Volume of
Final total
volume (ul)
sample for
25ug (uL)
gel
loading
buffer
Tris for
sample
CRUDE
8
25
17
50
FLOW THRU
50
PRE
50
DESALTING
POST
50
DESALTING](/v2/_next/image?url=https%3A%2F%2Fcontent.bartleby.com%2Fqna-images%2Fquestion%2F75b47bd2-f578-4dc9-8cbd-5516e6395fc3%2F6a90c364-2dc0-42b5-af44-78e309c447a0%2Fpzzjtna_processed.png&w=3840&q=75)
Transcribed Image Text:2. Use the linear regression equation and the following Abs 595 data and dilution factors for
calculating your protein concentrations:
SAMPLE
ABS 595
DILUTION
Calculated
FACTOR
[protein]
(mg/mL)
CRUDE
0.114
10
3.098
FLOW THRU
0.119
5
PRE DESALTING
0.176
3
POST DESALTING
0.157
3
3. Using the protein concentrations that you calculated, determine the volume in ul of each sampl
that would be needed to load 25ug of that sample on an SDS-PAGE. See example in the first row of
the table.
SAMPLE
Volume of
Vol of 4x
Volume of
Final total
volume (ul)
sample for
25ug (uL)
gel
loading
buffer
Tris for
sample
CRUDE
8
25
17
50
FLOW THRU
50
PRE
50
DESALTING
POST
50
DESALTING
Expert Solution
This question has been solved!
Explore an expertly crafted, step-by-step solution for a thorough understanding of key concepts.

This is a popular solution!

Trending now
This is a popular solution!

Step by step
Solved in 2 steps with 2 images

Knowledge Booster


Learn more about
Need a deep-dive on the concept behind this application? Look no further. Learn more about this topic, chemistry and related others by exploring similar questions and additional content below.Recommended textbooks for you

Principles of Instrumental Analysis
Chemistry
ISBN:
9781305577213
Author:
Douglas A. Skoog, F. James Holler, Stanley R. Crouch
Publisher:
Cengage Learning
Principles of Instrumental Analysis
Chemistry
ISBN:
9781305577213
Author:
Douglas A. Skoog, F. James Holler, Stanley R. Crouch
Publisher:
Cengage Learning