*2.13 Compute the mean change in cholesterol. *2.14 Compute the standard deviation of the change in cholesterol levels. 2.15 Construct a stem-and-leaf plot of the cholesterol changes.
*2.13 Compute the mean change in cholesterol. *2.14 Compute the standard deviation of the change in cholesterol levels. 2.15 Construct a stem-and-leaf plot of the cholesterol changes.

Glencoe Algebra 1, Student Edition, 9780079039897, 0079039898, 2018
18th Edition
ISBN:9780079039897
Author:Carter
Publisher:Carter
Chapter10: Statistics
Section10.1: Measures Of Center
Problem 9PPS

Related questions
Question
Please only answer 2.18.
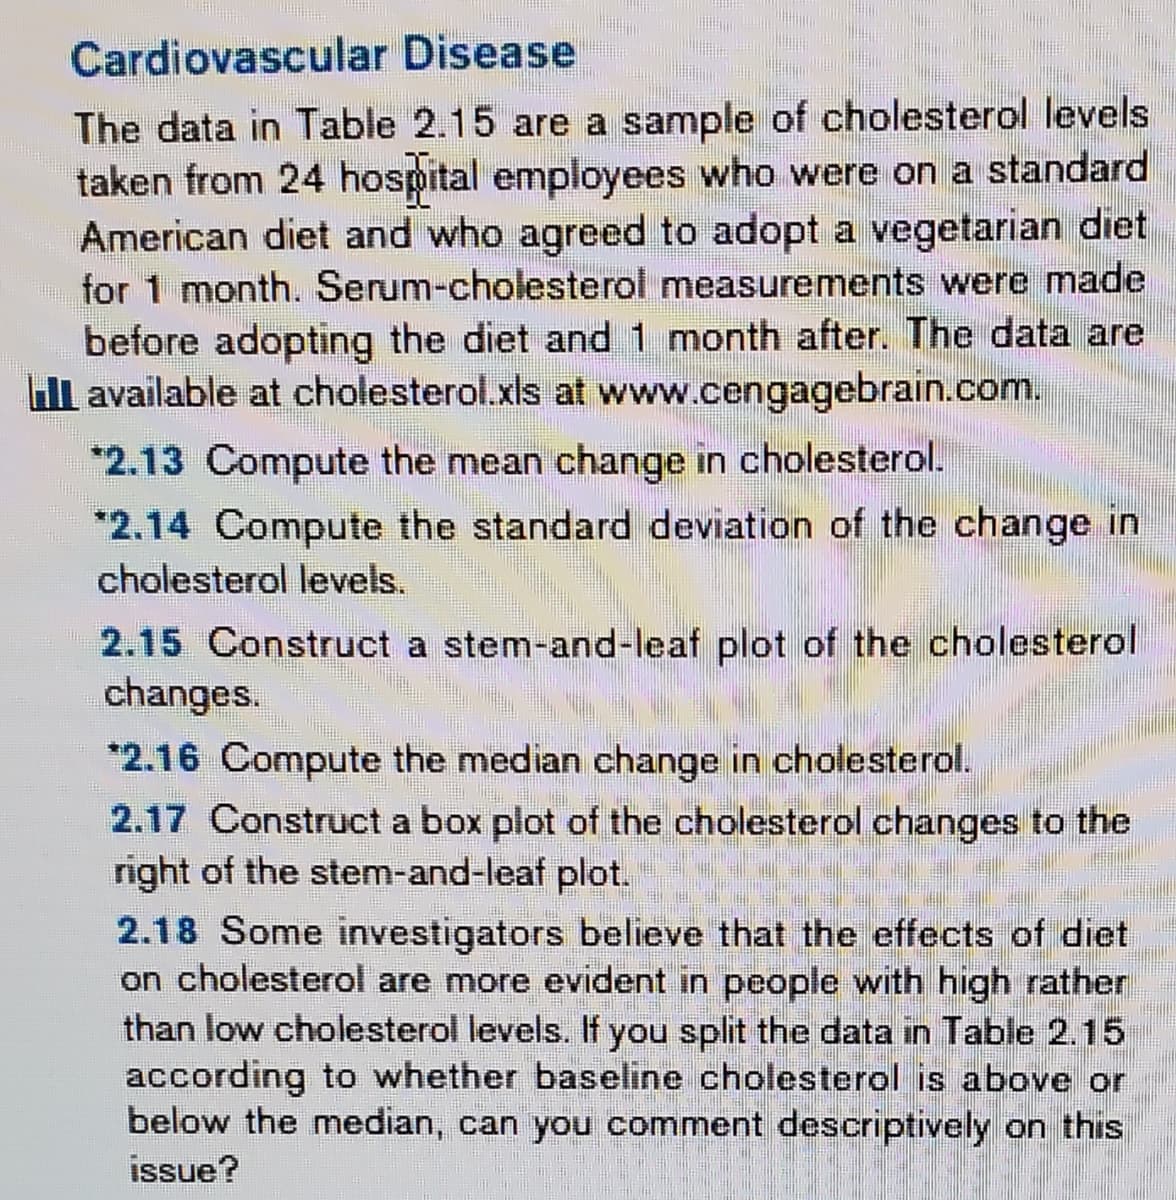
Transcribed Image Text:Cardiovascular Disease
The data in Table 2.15 are a sample of cholesterol levels.
taken from 24 hospital employees who were on a standard
American diet and who agreed to adopt a vegetarian diet
for 1 month. Serum-cholesterol measurements were made
before adopting the diet and 1 month after. The data are
Il available at cholesterol.xls at www.cengagebrain.com.
*2.13 Compute the mean change in cholesterol.
*2.14 Compute the standard deviation of the change in
cholesterol levels.
2.15 Construct a stem-and-leaf plot of the cholesterol
changes.
*2.16 Compute the median change in cholesterol.
2.17 Construct a box plot of the cholesterol changes to the
right of the stem-and-leaf plot.
2.18 Some investigators believe that the effects of diet
on cholesterol are more evident in people with high rather
than low cholesterol levels. If you split the data in Table 2.15
according to whether baseline cholesterol is above or
below the median, can you comment descriptively on this
issue?

Transcribed Image Text:TABLE 2.15 Serum-cholesterol
Subject
1
2
3
5
6
7
8
9
10
11
12
13
14
15
16
17
18
19
20
21
22
23
24
10.
and after adopting a vegetarian diet
Before
195
145
205
159
244
166
250
236
192
224
238
197
169
158
151
197
180
222
168
168
167
161
178
137
After
146
155
178
146
208
147
202
215
184
208
206
169
182
127
149
levels (mg/dL) before
178
161
187
176
145
154
153
137
125
Difference
49
-10
27
13
36
48
21
8
16
32
28
-13
2
19
35
-8
23
HET
13
8
41
12
Expert Solution
This question has been solved!
Explore an expertly crafted, step-by-step solution for a thorough understanding of key concepts.

This is a popular solution!

Trending now
This is a popular solution!

Step by step
Solved in 4 steps

Recommended textbooks for you
Glencoe Algebra 1, Student Edition, 9780079039897…
Algebra
ISBN:
9780079039897
Author:
Carter
Publisher:
McGraw Hill

College Algebra (MindTap Course List)
Algebra
ISBN:
9781305652231
Author:
R. David Gustafson, Jeff Hughes
Publisher:
Cengage Learning

Mathematics For Machine Technology
Advanced Math
ISBN:
9781337798310
Author:
Peterson, John.
Publisher:
Cengage Learning,
Glencoe Algebra 1, Student Edition, 9780079039897…
Algebra
ISBN:
9780079039897
Author:
Carter
Publisher:
McGraw Hill
College Algebra (MindTap Course List)
Algebra
ISBN:
9781305652231
Author:
R. David Gustafson, Jeff Hughes
Publisher:
Cengage Learning
Mathematics For Machine Technology
Advanced Math
ISBN:
9781337798310
Author:
Peterson, John.
Publisher:
Cengage Learning,