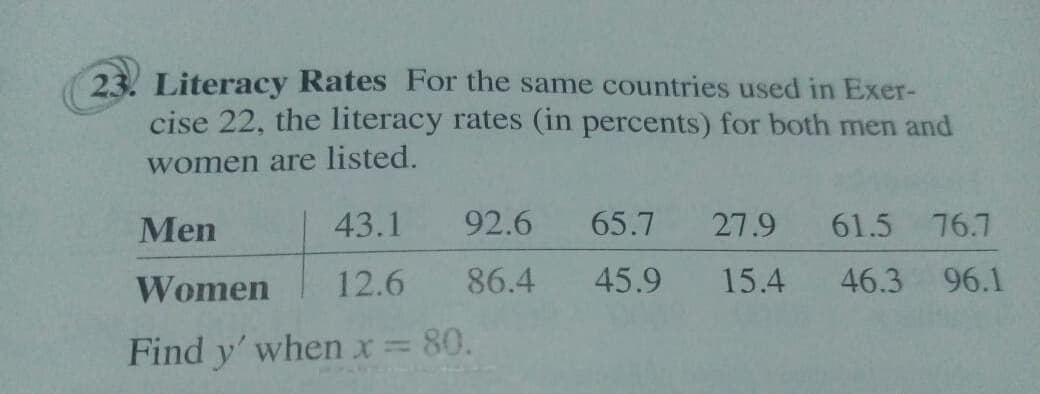
23. Literacy Rates For the same countries used in Exer- cise 22, the literacy rates (in percents) for both men and women are listed. Men 43.1 92.6 65.7 27.9 61.5 76.7 Women 12.6 86.4 45.9 15.4 46.3 96.1 Find y' when x = 80.


Q: Step 1: Enter the number of degrees of freedom. Step 2: Select one-tailed or two-tailed. O…
A: The mean amount of gamma radiation needed to sterilize a colony of tardigrades is not equal to 1150…
Q: 8. Suppose you intend to estimate the impact of number of kids in a household on mother's labor…
A: When you add another independent variable in the equation R2 will always increase. So here we are…
Q: A new coal liquefaction process is being studied. It is claimed that the new process results in a…
A: Given Information:…
Q: The population of a town with a 2000 population of 63,826 grows at a rate of 2.4% per year. Create a…
A: Thanks for the question :)And your upvote will be really appreciable ;)
Q: Suppose the incidence rate of myocardial infarction (MI) was 5 per 1000 among 45- to 54-year-old men…
A: 7.14 Null Hypothesis: H0:p1=p2 That is, there is no difference between the 24-hour…
Q: The result below gives the amount (mg/mL) of ephedrine hydrochloride found in pharmaceutical…
A:
Q: The table to the right gives the cost of living index (COLI) for six East Coast counties and six…
A: Given: East Coast Counties Midwest Counties A 104.1 96.4 B 128.3 92.7 C 314.5 94.2 D…
Q: 1- The article “Effect of Internal Gas Pressure on the Com- pression Strength of Beverage Cans and…
A: Define the null and alternative hypothesis: The null hypothesis, H0 is defined that the mean…
Q: TABLE 10.22 Number of children with olonhea at 2 weeks of follow-up Number of chldren with otonhea…
A: Since you have asked multiple questions, we will solve the first question for you. If you want any…
Q: min max wth rate sales/month uniform 0.001 0.0 rting em triangular S 120.00 $ mean sd wth…
A: Q
Q: Suppose that the Lorenz Curve for country A is given by yA = x 2.2 and for country B is yB = 0.3x 2…
A: Step:- 1 Gini index / coefficient Formula is Gi=∫01x dx-∫01f(x) dx1/2Here, ∫01x dx = 12= Area of y=x…
Q: concentration for a sample of mentally impaired children for which the cause of impairment was…
A: Given data : sample size, n = 41 sample mean, x̄ = 16.0 sample standard…
Q: 6. Suppose that X is an Exponential with rate 1 and that, given X = x, Y is an Exponential with rate…
A:
Q: (3) a) Establish the relationship between the hazard function h(t) and in- cidence proportion at…
A: Given an estimated hazard function at time t=4 is 1.5.
Q: Over the first 4 years, species A has grown more than species B. Over the first 4 years, species B…
A: From the graphs, it can be seen that in first four years, with time, value of both species A and…
Q: he following data calculate the groSs and net roproduction rates of females. Can you also calculate…
A:
Q: his is your experimental data for Experiment #7, Determination of Glucose Using a Biosensor. YOU…
A: Given Information: Standard 1 has a meter reading of 84 mg/dL Standard 2 has a meter reading of 127…
Q: 4. From the following figures calculate the female gross reproduction rate if the ratio of male and…
A:
Q: Due to continuous heavy losses the management decides to bring down the strength to 30% of the…
A: The term central tendency refers to the center, or typical, value of a group of information, which…
Q: In Exercises 37–42, find ||v|| and find the unit vector in the direction of v. 37. v = (3, –4) 38. v…
A: 37). Given vector is v=3,-4. To find v and find the unit vector in the direction of v. Solution: We…
Q: The percentage of men age 65 years and older in the workforce from 1950 (t = 0) through 2000 (t =…
A:
Q: Based on the current data, what date should you schedule the chemical delivery? The customer…
A: Regression Equation: When we want to predict the value of one variable, say y, from the given value…
Q: Statistics Multiple R R Square Adjusted R Sq ? Standard Error ? Observations 15 ANOVA df SS MS…
A: 2.Areal estate company wants to study the relationship between Home price (in OMR 1000) and the…
Q: 13. Find the correlation coefficient between X and Y if the joint pdf of X and Y is given by
A:
Q: Suppose that George wants to determine if the number of insects in a given area is related to the…
A: we have give that x1=5 ,x2=9 ,x3=10 ,xbar=8 ,sdx=2.646 and y1=17,y2=1,y3=15,ybar=11,sdy=8.718 n=3
Q: This is a hypothetical question. Suppose that the CMA at period t is 60050 units and the…
A:
Q: 2. (Example 2): At a test site in Great Sand Dunes National Park, Colorado, the prevailing wind did…
A: Given Sample mean x̄=1075, standard deviations σ=265, n=60 Moe=margin of error=75
Q: In a hypothetical city, there is a population of 200,000 people. During the year 2000, there were…
A: Given information: The total population is N = 200,000. It is given that all new cases of disease X…
Q: Suppose , and uz are true mean stopping distances at 50 mph for cars of a certain type equipped with…
A: A confidence interval is a type of estimate computed from the statistics of the observed data. This…
Q: 4. A gravity concentration plant is processing 10,000 MT/D of gold ore. In order to attain a…
A:
Q: Consider the following model for Malaysia from year 2009 to 2018. Y = 15.2689+0.8546 X, – 0.3259 X;…
A: Let Y: Consumption expenditure(RM) X1: Income(RM) X2: Wealth(RM) n=10 Since R2 value=0.9985 implies…
Q: Hote the dearee Ond lending Coeffcient of eocn folynamial in ane variable IS iH is not a polyromia…
A: the degree of a polynomial is the highest of the degrees of the polynomial's monomials (individual…
Q: 5.a Suppose that 70% of all faculty members at large public universities in the US use iClickers in…
A: Given Information: 70% of all faculty members at large public universities in the US use iClickers…
Q: 4. The removal rate y measures the fraction of individuals in the infectious class that stops being…
A:
Q: In order to monitor the filling process of flour into bags, X-bar and R control charts are to be…
A: The mean of the all sample means is, x¯¯=∑x¯k=52.084=13.02 The mean of the ranges of 4 samples is,…
Q: A contractor is planning to bid for a job of filling potholes on a given stretch of a high way.…
A: There are certain number of potholes detected by different agencies per kilometre. Given, number of…
Q: The probability of not matching the salts ratio to sand from a given source is 0.2 and the…
A: The probability of not matching the salts ratio to sand from a given source = 0.2 The probability…
Q: Sociologists recognize a phenomenon called social diffusion, which is the spreading of a piece of…
A: Use N and an to find the number of people who doesn't know the information. Then, use these data to…
Q: 4. A telephone poll was conducted in a large area to determinc if there was a rclationship between…
A: option d which is "The survey had significant results so it seems that education level causes an…
Q: Identify the following underlined quantitative variables as Discrete or continuous. Write D if…
A: (1) Identify the given quantitative variable is as Discrete or continuous. The correct option…
Q: The molecular weight of a particular polymer should fall between 750 and 1,035. Thirty samples of…
A: The answer is attached below,
Q: A manufacturing company has been experimenting with a new additive that is used to reduce polluting…
A:
Q: The correlation between X and Y is r = 0.35. %3D Based on this r value, is this a good equation to…
A:
Q: 1. When variable X is directly related to variable Y, then as variable X decreases – what happens to…
A: 1) In correlation, if the variable X decreases then the variable Y is also decreases. Therefore, the…
Q: Too determine the relationship between years of education and salary potential, 10 persons who have…
A: Person's product moment coefficient correlation is given by, In the above table, sample size is n=…
Q: Suppose u, and u, are true mean stopping distances at 50 mph for cars of a certain type equipped…
A: Introduction:
Q: Two different analytical methods were used to determine residual chlorine in sewage nethods were…
A: Given information: The data represents the concentration of CI in mg/L for a sample of 8…
Q: 16) Unfortunately, arsenic occurs naturally in some ground water (Reference: Union Carbide Technical…
A: Note: You have solved part (a) correctly. As given, a random sample of 37 tests gave a sample…
Q: Quintile of Population Quintile's % of Income, Colombia, 2010 Quintile's % of Income, Finland, 2010…
A: To calculate Gini Coefficient, The following formula is used. Gini Coefficient = 1-Aggregate score…
Q: 1) If the sum of the squares of five numbers is 165 and their variance is 8. What is the mean of…
A: Since multiple questions are asked, I am answering first question

Step by step
Solved in 3 steps with 4 images


- The mean ±1 sd of ln [calcium intake (mg)] among 25females, 12 to 14 years of age, below the poverty level is6.56 ± 0.64. Similarly, the mean ± 1 sd of ln [calcium intake(mg)] among 40 females, 12 to 14 years of age, above thepoverty level is 6.80 ± 0.76.*8.7 Suppose an equal number of 12- to 14-year-old girlsbelow and above the poverty level are recruited to studydifferences in calcium intake. How many girls should berecruited to have an 80% chance of detecting a significantdifference using a two-sided test with α = .05?What is the average NO3- concentration at the upslope site (3 decimal places)? What is the average NO3- concentration at the downslope site ( 3 decimal places)? Given the EPA drinking water quality standard is 10 mg/L of nitrate, is the upslope site safe to drink based only on nitrate content? (Enter yes or no) Is the downslope site safe to drink, based only on NO3- concentration? (Enter yes or no) Assuming the two sites are hydrologically well connected, the transit time between the two sites is fast, and the two sites cannot be treated as independent samples, what kind of t-test should be performed to show that the upslope site is greater than the downslope site? Enter the letter of your answer choice in the answer blank A. one-tailed unpaired t-testB. two-tailed unpaired t-testC. one-tailed paired t-testD. two-tailed paired t-test What is the calculated t statistic, rounded to 4 decimal places? Is the calculated t statistic greater or less than the critical t value reported by…How to calculate Samsung’s cost (C(Q)) of producing 1,2,...15
- Age (YRS) Mass (KG) Cigarettes (Per Day) Risk Index (R.I.) (--) 46 113 40 974.5 35 96 32 670.68 43 81 26 409.26 39 93 50 1484.5 22 66 25 500 58 55 33 631.87 60 72 15 350.75 54 93 19 347.09 32 55 12 308.78 63 115 24 580.74 30 105 20 320.5 24 90 19 381.59 55 65 15 274.25 30 115 6 322.66 40 115 21 411.11 34 80 22 396.48 31 88 22 906 70 57 33 616.87 35 116 43 1072.07 57 101 31 589.41 44 68 36 718.56 66 118 33 790.37 46 120 44 1129.84 20 72 19 487 64 63 35 665.25 30 113 3 204.26 32 70 20 312 37 68 23 299.67 52 88 26 418.76 64 70 46 1299.36 23 87 23 422.17 42 53 50 1500.5 54 64 15 299.75 35 95 49 1536.99 51 95 39 912.69 61 105 20…Suppose the incidence rate of myocardial infarction (MI)was 5 per 1000 among 45- to 54-year-old men in 2000.To look at changes in incidence over time, 5000 men in thisage group were followed for 1 year starting in 2010. Fifteennew cases of MI were found. Suppose that 25% of patients with MI in 2000 died within24 hours. This proportion is called the 24-hour case-fatalityrate. >Suppose we eventually plan to accumulate 50 MIcases during the period 2010–2015. Assume that the24-hour case-fatality rate is truly 20% during this period.How much power would such a study have in distinguishingbetween case-fatality rates in 2000 and 2010–2015 if atwo-sided test with significance level .05 is planned?The American Heart Association is about to conduct an anti-smoking campaign and wants to know the fraction of Americans over 38 who smoke. Step 1 of 2: Suppose a sample of 273 Americans over 38 is drawn. Of these people, 79 smoke. Using the data, estimate the proportion of Americans over 38 who smoke. Enter your answer as a fraction or a decimal number rounded to three decimal places. Step 2 of 2: Suppose a sample of 273 Americans over 38 is drawn. Of these people, 79 smoke. Using the data, construct the 85% confidence interval for the population proportion of Americans over 38 who smoke. Round your answers to three decimal places. Lower end point, upper end point
- A gerontologist investigating various aspects of aging process wanted to see whether staying “ lean and mean, “ that is, being under normal body inbred line to one of three diets: (1) unlimited access to food, (2) 90% of the amount of food that a rat of size would normally eat, or (3) 80% of amount of food that a rat of the size would normally eat. She maintained the rats on three diets throughout their lives and recorded their lifespans (in years). Five rates in each group. Is there evidence that diet affected life span in this study? Let α= 0.01 Complete the ANOVA table . Source of variation df SS MS Fc Treatment 2 1.575 Error 12 Total 14 5.60 A) Hypothesis Test H0: H1: B) Test Statistic C) Decision Rule d) Conclusion *(please with equations and explanation) and thamnk youIn a certain jurisdiction, all students in Grade Three are required to take a standardized test to evaluate their math comprehension skills.The file contains these data resulting from a random sample of n=30 schools within this jurisdiction. From these data you wish to estimate the model Yi=β0+β1Xi+ei where Xi is the percentage of Grade Three students in School i who live below the poverty line and Yi is the average mathematics comprehension score for all Grade Three students in the same school, School i. The observed data for the X variable is labled perbelowpoverty and the observed data for the Y variable is labeled mathscore in the file.Import (either hand type or load the file) data into R Studio, then answer the following questions based on the data.(a) Create a scatterplot of the data. What can you say about the nature of the relationship between the percentage of Grade Three students living below the poverty line in a certain school and the school's average Grade Three…A chemical reaction is run 12 times, and the temperature xi (in °C) and the yield yi (in percent of a theoretical maximum) is recorded each time. The following summary statistics are recorded: x⎯⎯=65.0, y⎯⎯=29.03,∑ni=1(xi−x⎯⎯)2=6032.0,∑ni=1(yi−y⎯⎯)2=835.42,∑ni=1(xi−x⎯⎯)(yi−y⎯⎯)=1988.6x¯=65.0, y¯=29.03,∑i=1n(xi−x¯)2=6032.0,∑i=1n(yi−y¯)2=835.42,∑i=1n(xi−x¯)(yi−y¯)=1988.6 Let β0 represent the hypothetical yield at a temperature of 0°C, and let β1 represent the increase in yield caused by an increase in temperature of 1°C. Assume that assumptions 1 through 4 for errors in linear models hold. Find a 95% prediction interval for the yield of a particular reaction at a temperature of 40°C. Round the answers to three decimal places. The 95% prediction interval is ( , ).
- A chemical reaction is run 12 times, and the temperature xi (in °C) and the yield yi (in percent of a theoretical maximum) is recorded each time. The following summary statistics are recorded: x⎯⎯=65.0, y⎯⎯=29.03,∑ni=1(xi−x⎯⎯)2=6032.0,∑ni=1(yi−y⎯⎯)2=835.42,∑ni=1(xi−x⎯⎯)(yi−y⎯⎯)=1988.6x¯=65.0, y¯=29.03,∑i=1n(xi−x¯)2=6032.0,∑i=1n(yi−y¯)2=835.42,∑i=1n(xi−x¯)(yi−y¯)=1988.6 Let β0 represent the hypothetical yield at a temperature of 0°C, and let β1 represent the increase in yield caused by an increase in temperature of 1°C. Assume that assumptions 1 through 4 for errors in linear models hold. Compute the error variance estimate s2. Round the answer to three decimal places.A chemical reaction is run 12 times, and the temperature xi (in °C) and the yield yi (in percent of a theoretical maximum) is recorded each time. The following summary statistics are recorded: x⎯⎯=65.0, y⎯⎯=29.03,∑ni=1(xi−x⎯⎯)2=6032.0,∑ni=1(yi−y⎯⎯)2=835.42,∑ni=1(xi−x⎯⎯)(yi−y⎯⎯)=1988.5x¯=65.0, y¯=29.03,∑i=1n(xi−x¯)2=6032.0,∑i=1n(yi−y¯)2=835.42,∑i=1n(xi−x¯)(yi−y¯)=1988.5 Let β0 represent the hypothetical yield at a temperature of 0°C, and let β1 represent the increase in yield caused by an increase in temperature of 1°C. Assume that assumptions 1 through 4 for errors in linear models hold. Find 95% confidence intervals for β0 and β1. Round the answers to three decimal places. The 95% confidence interval for β0 is ( , ). The 95% confidence interval for β1 is ( , ).In a geographical location with a mid-year population of 1,000,000 (1 million) there were 1125 deaths during an entire year due to all causes combined.Out of those 1125 deaths, 185 deaths were due to causes related to pregnancy and 165 deaths were among children less than one-year old. There were 650 live births that year in that location. Please select the correct option(s) from the following. a. The maternal mortality ratio was 25 per 100 live births b. Infant mortality was 17 per 100,000live births c. The infant mortality was 254 per 1,000 live births d. The maternal mortality was 285 per 1,000 live births


