3-day busihess trip in miy selected Citles. The accomnpanying data represent the total travel tax (in dollars) for normal probability plot suggests the data could come from a population that is normally distributed. A boxplot indicates there are no outliers. Complete parts (a) through (c) below. 68.82 79.26 68.51 84.96 80.53 87.25 101.72 98.77 3 Click the icon to view the table of critical t-values. (a) Determine a point estimate for the population mean travel tax. A point estimate for the population mean travel tax is $ (Round to two decimal places as needed.) (b) Construct and interpret a 95% confidence interval for the mean tax paid for a three-day business trip. Select the correct choice below and fill in the answer boxes to complete your choice. (Round to two decimal places as needed.) O A. The travel tax is between $ and $ for % of all cities. B. There is a % probability that the mean travel tax for all cities is between $ and $ O C. One can be % confident that the mean travel tax for all cities is between $ and $ O D. One can be % confident that the all cities have a travel tax between $ and $ (c) What would you recommend to a researcher who wants to increase the precision of the interval, but does not have access to additional data? O A. The researcher could increase the level of confidence. O B. The researcher could increase the sample mean.
3-day busihess trip in miy selected Citles. The accomnpanying data represent the total travel tax (in dollars) for normal probability plot suggests the data could come from a population that is normally distributed. A boxplot indicates there are no outliers. Complete parts (a) through (c) below. 68.82 79.26 68.51 84.96 80.53 87.25 101.72 98.77 3 Click the icon to view the table of critical t-values. (a) Determine a point estimate for the population mean travel tax. A point estimate for the population mean travel tax is $ (Round to two decimal places as needed.) (b) Construct and interpret a 95% confidence interval for the mean tax paid for a three-day business trip. Select the correct choice below and fill in the answer boxes to complete your choice. (Round to two decimal places as needed.) O A. The travel tax is between $ and $ for % of all cities. B. There is a % probability that the mean travel tax for all cities is between $ and $ O C. One can be % confident that the mean travel tax for all cities is between $ and $ O D. One can be % confident that the all cities have a travel tax between $ and $ (c) What would you recommend to a researcher who wants to increase the precision of the interval, but does not have access to additional data? O A. The researcher could increase the level of confidence. O B. The researcher could increase the sample mean.

Glencoe Algebra 1, Student Edition, 9780079039897, 0079039898, 2018
18th Edition
ISBN:9780079039897
Author:Carter
Publisher:Carter
Chapter10: Statistics
Section10.4: Distributions Of Data
Problem 19PFA

Related questions
Question
Transcribed Image Text:Area in
right tail
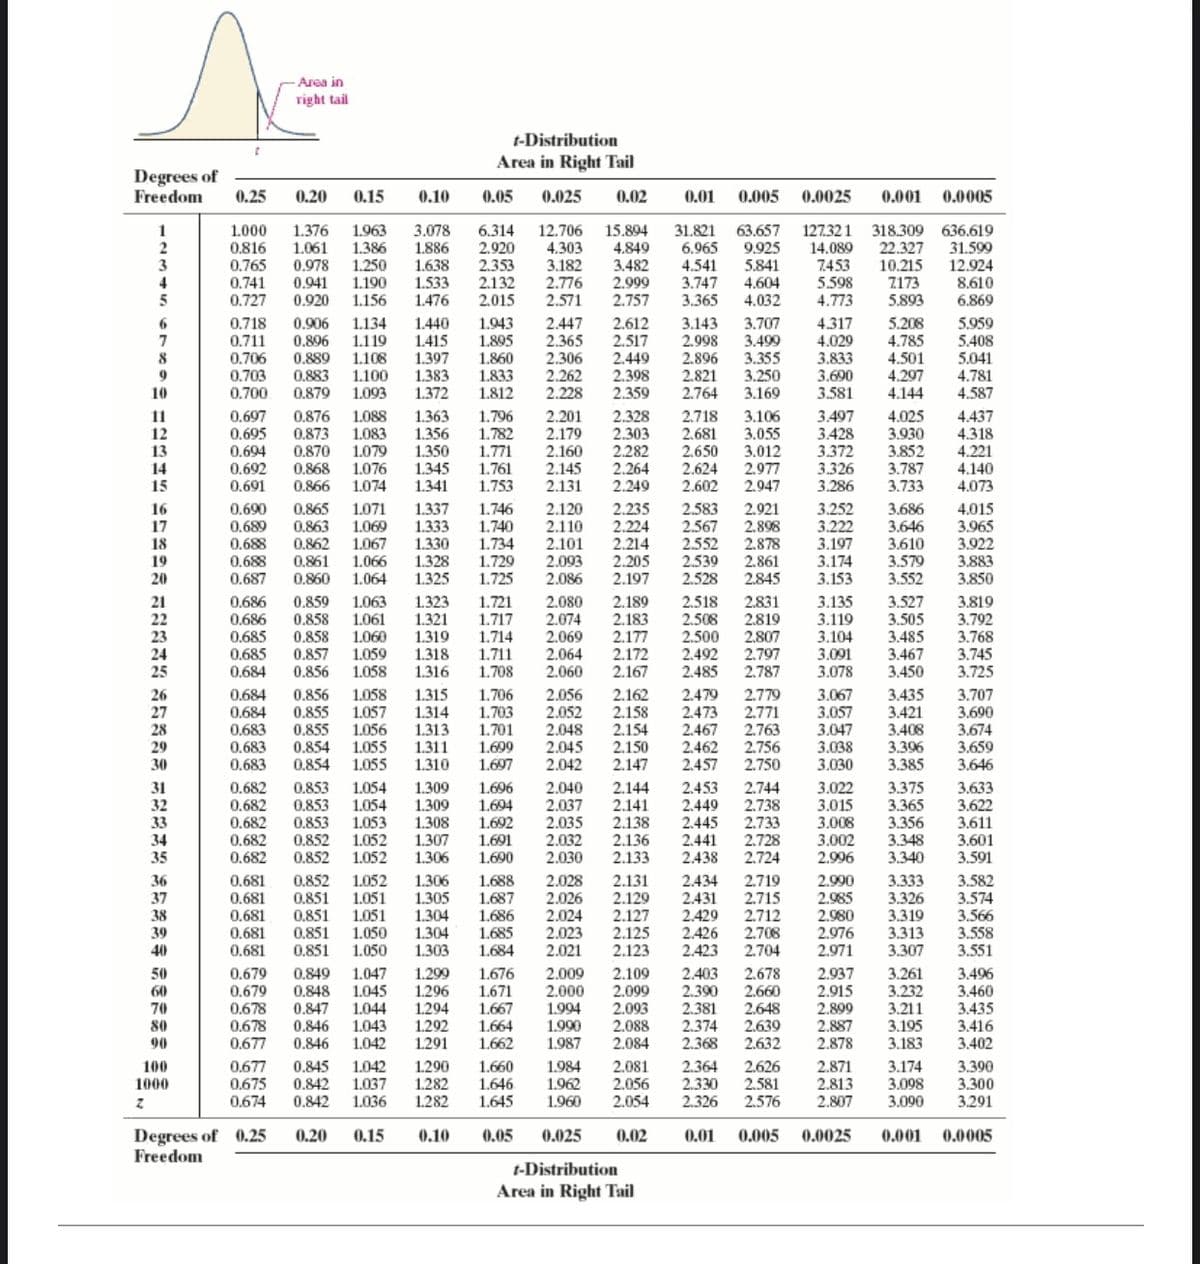
t-Distribution
Area in Right Tail
Degrees of
Freedom
0.25
0.20
0.15
0.10
0.05
0.025
0.02
0.01
0.005
0.0025
0.001
0.0005
1.000
0.816
0.765
0.741
0.727
1.376
1.061
0.978
0.941
0.920
1.963
1.386
1.250
1.190
1.156
3.078
1.886
1.638
1.533
1.476
6.314
2.920
2.353
2.132
2.015
12.706
4.303
3.182
2.776
2.571
15.894
4.849
3.482
2.999
2.757
63.657
9.925
5.841
127.32 1
14.089
7.453
5.598
4.773
318.309 636.619
22.327
10.215
7173
5.893
1
31.821
6.965
4.541
3.747
3.365
31.599
12.924
8.610
6.869
4.604
4.032
0.718
0.711
0.706
0.703
0.700
1.440
1.415
1.397
1.383
1.372
1.943
1.895
1.860
1.833
1.812
2.612
2.517
2.449
2.398
2.359
3.707
3.499
3.355
3.250
3.169
0.906
0.896
0.889
0.883
0.879
1.134
1.119
1.108
1.100
1.093
2.447
2.365
2.306
2.262
2.228
3.143
2.998
2.896
2.821
2.764
4.317
4.029
3.833
3.690
3.581
5.208
4.785
4.501
4.297
5.959
5.408
5.041
4.781
4.587
10
4.144
0.697
0.695
0.694
0.692
0.691
0.876
0.873
0.870
0.868
0.866
1.363
1.356
1.350
1.345
1.796
1.782
1.771
1.761
1.753
2.201
2.179
2.160
2.145
2.131
2.328
2.303
2.282
2.264
2.249
2.718
2.681
2.650
2.624
2.602
3.106
3.055
3.012
2.977
2.947
3.497
3.428
3.372
3.326
4.025
3.930
3.852
3.787
3.733
11
1.088
1.083
1.079
1.076
4.437
4.318
4.221
4.140
4.073
13
14
15
1.074
1.341
3.286
0.865
0.863
0.862
0.861
0,860
16
17
0.690
0,689
0.688
0.688
0.687
1.071
1.069
1.067
1.337
1.333
1.330
1.328
1.325
1.746
1.740
1.734
1.729
1.725
2.120
2.110
2.101
2.093
2.086
2.235
2.224
2.214
2.205
2.197
2.583
2.567
2.552
2.539
2.528
2.921
2.898
2.878
2.861
2.845
3.252
3.222
3.197
3.174
3.153
3.686
3.646
3.610
3.579
3.552
4.015
3.965
3.922
3.883
3.850
18
19
20
1.066
1.064
2.080
2.074
2.069
2.064
2.060
2.189
2.183
2.177
2.172
2.518
2.508
2.500
2.492
2.485
2.831
2.819
2.807
2.797
2.787
3.135
3.119
3.104
3.091
3.078
3.527
3.505
3.485
3.467
3.450
21
0.686
0.686
0.685
0.685
0.684
0.859
0.858
0.858
0.857
0.856
1.063
1.061
1.060
1.059
1.058
1.323
1.321
1.319
1.318
1.721
1.717
1.714
1.711
1.708
3.819
3.792
3.768
3.745
3.725
1.316
2.167
26
27
28
29
30
0.684
0.684
0.683
0,683
0.683
0.856
0.855
0.855
0.854
0.854
1.058
1.057
1.056
1.055
1.055
1.315
1.314
1.313
1.311
1.310
1.706
1.703
1.701
1.699
1.697
2.056
2.052
2.048
2.045
2.042
2.162
2.158
2.154
2.150
2.147
2.479
2.473
2.467
2.462
2.457
2.779
2.771
2.763
2.756
2.750
3.067
3.057
3.047
3.038
3.030
3.435
3.421
3.408
3.396
3.385
3.707
3.690
3.674
3.659
3.646
0.853
0.853
0.853
0.852
0.852
1.054
1.054
1.053
1.052
1.052
2.144
2.141
2.138
2.136
2.133
2.453
2.449
2.445
2.441
2.438
3.375
3.365
3.356
3.348
3.340
31
32
0.682
0.682
0.682
0.682
0.682
1.309
1.309
1.308
1.307
1.306
1.696
1.694
1.692
1.691
1.690
2.040
2.037
2.035
2.032
2.030
2.744
2.738
2.733
2.728
2.724
3.022
3.015
3.008
3.633
3.622
3.611
3.601
3.591
34
35
3.002
2.996
36
37
38
39
40
0.681
0.681
0.681
0.681
0.681
0.852
0.851
0.851
0.851
0.851
1.052
1.051
1.051
1.050
1.050
1.306
1.305
1.304
1.304
1.303
1.688
1.687
1.686
1.685
1.684
2.028
2.026
2.024
2.023
2.021
2.131
2.129
2.127
2.125
2.123
2.434
2.431
2.429
2.426
2.423
2.719
2.715
2.712
2.706
2.704
2.990
2.985
2.980
2.976
2.971
3.333
3.326
3.319
3.313
3.307
3.582
3.574
3.566
3.558
3.551
0.679
0.679
0.678
0.678
0.677
1.047
1.045
1.044
1.043
1.042
1.299
1.296
1.294
1.292
1.291
1.676
1.671
1.667
1.664
1.662
2.109
2.099
2.093
2.088
2.084
2.403
2.390
2.381
2.374
2.368
2.937
2.915
2.899
2.887
2.878
3.261
3.232
3.211
3.195
3.183
3.496
3.460
3.435
3.416
3.402
50
0.849
0.848
0.847
0.846
0.846
2.009
2.000
1.994
1.990
1.987
2.678
2.660
2.648
2.639
2.632
60
70
80
90
0.677
0.675
0.674
1.042
1.037
1.290
1.282
1.282
1.660
1.646
1.645
1.984
1.962
1.960
2.081
2.056
2.054
2.364
2.330
2.326
2.626
2.581
2.576
2.871
2.813
2.807
3.174
3.098
3.090
3.390
3.300
3.291
100
0.845
0.842
0.842
1000
1.036
Degrees of 0.25
Freedom
0.20
0.15
0.10
0.05
0.025
0.02
0.01
0.005
0.0025
0.001
0.0005
t-Distribution
Area in Right Tail
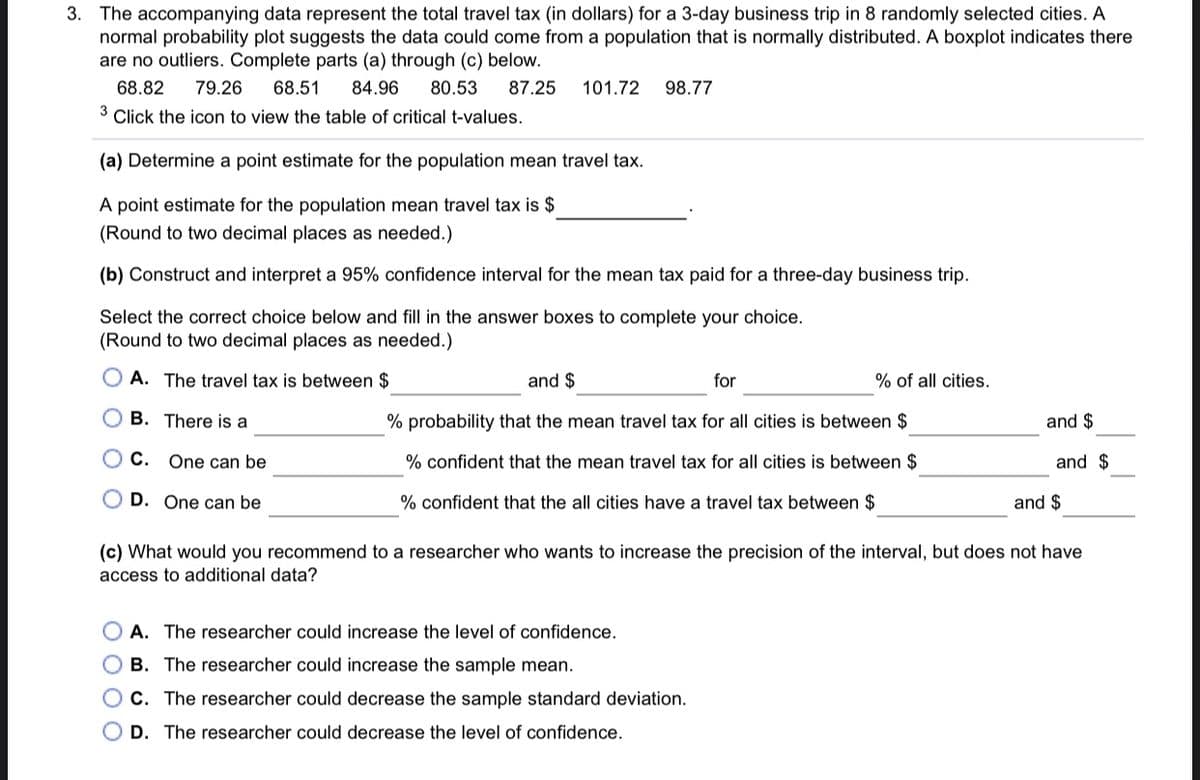
Transcribed Image Text:3. The accompanying data represent the total travel tax (in dollars) for a 3-day business trip in 8 randomly selected cities. A
normal probability plot suggests the data could come from a population that is normally distributed. A boxplot indicates there
are no outliers. Complete parts (a) through (c) below.
68.82
79.26
68.51
84.96
80.53
87.25
101.72
98.77
3
Click the icon to view the table of critical t-values.
(a) Determine a point estimate for the population mean travel tax.
A point estimate for the population mean travel tax is $
(Round to two decimal places as needed.)
(b) Construct and interpret a 95% confidence interval for the mean tax paid for a three-day business trip.
Select the correct choice below and fill in the answer boxes to complete your choice.
(Round to two decimal places as needed.)
O A. The travel tax is between $
and $
for
% of all cities.
B. There is a
% probability that the mean travel tax for all cities is between $
and $
O C. One can be
% confident that the mean travel tax for all cities is between $
and $
D. One can be
% confident that the all cities have a travel tax between $
and $
(c) What would you recommend to a researcher who wants to increase the precision of the interval, but does not have
access to additional data?
A. The researcher could increase the level of confidence.
B. The researcher could increase the sample mean.
C. The researcher could decrease the sample standard deviation.
D. The researcher could decrease the level of confidence.
O O O O
Expert Solution
This question has been solved!
Explore an expertly crafted, step-by-step solution for a thorough understanding of key concepts.

This is a popular solution!

Trending now
This is a popular solution!

Step by step
Solved in 2 steps

Recommended textbooks for you
Glencoe Algebra 1, Student Edition, 9780079039897…
Algebra
ISBN:
9780079039897
Author:
Carter
Publisher:
McGraw Hill
Glencoe Algebra 1, Student Edition, 9780079039897…
Algebra
ISBN:
9780079039897
Author:
Carter
Publisher:
McGraw Hill