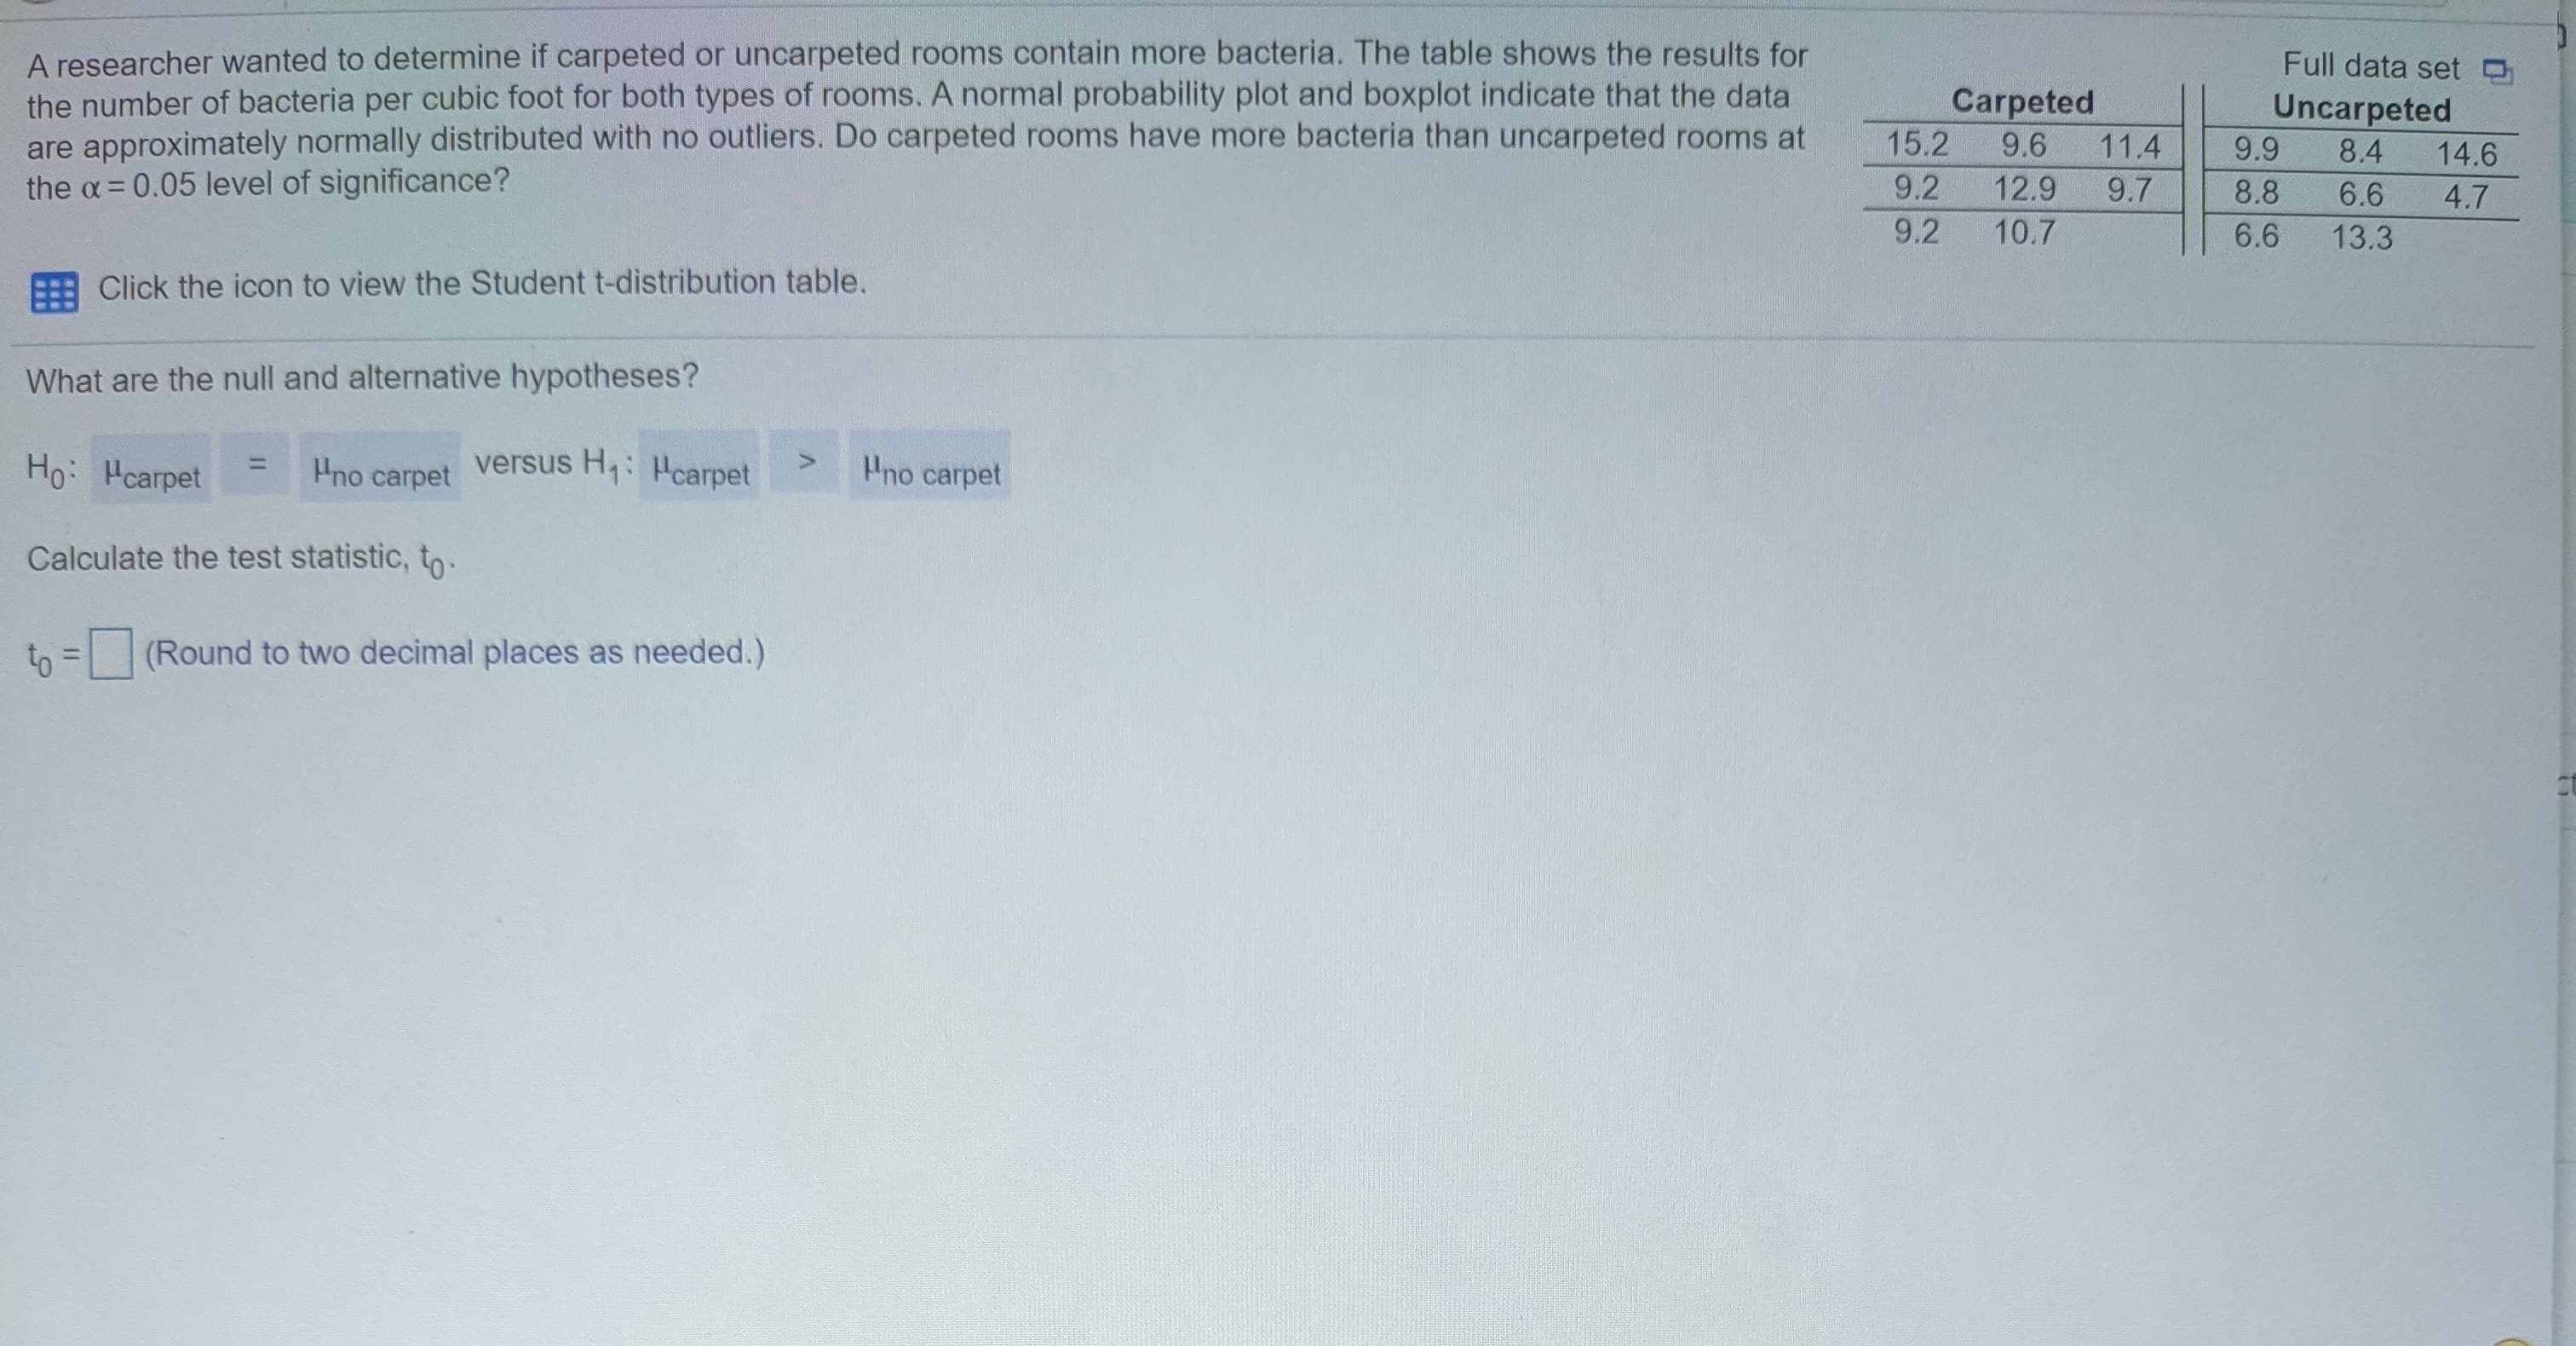
A researcher wanted to determine if carpeted or uncarpeted rooms contain more bacteria. The table shows the results for the number of bacteria per cubic foot for both types of rooms. A normal probability plot and boxplot indicate that the data are approximately normally distributed with no outliers. Do carpeted rooms have more bacteria than uncarpeted rooms at the a= 0.05 level of significance? Full data set Carpeted Uncarpeted 9.9 15.2 9.6 11.4 8.4 14.6 9.2 12.9 9.7 8.8 6.6 4.7 9.2 10.7 6.6 13.3 E Click the icon to view the Student t-distribution table. What are the null and alternative hypotheses?
A researcher wanted to determine if carpeted or uncarpeted rooms contain more bacteria. The table shows the results for the number of bacteria per cubic foot for both types of rooms. A normal probability plot and boxplot indicate that the data are approximately normally distributed with no outliers. Do carpeted rooms have more bacteria than uncarpeted rooms at the a= 0.05 level of significance? Full data set Carpeted Uncarpeted 9.9 15.2 9.6 11.4 8.4 14.6 9.2 12.9 9.7 8.8 6.6 4.7 9.2 10.7 6.6 13.3 E Click the icon to view the Student t-distribution table. What are the null and alternative hypotheses?

MATLAB: An Introduction with Applications
6th Edition
ISBN:9781119256830
Author:Amos Gilat
Publisher:Amos Gilat
Chapter1: Starting With Matlab
Section: Chapter Questions
Problem 1P

Related questions

Question
What is the test statistic and critical value?
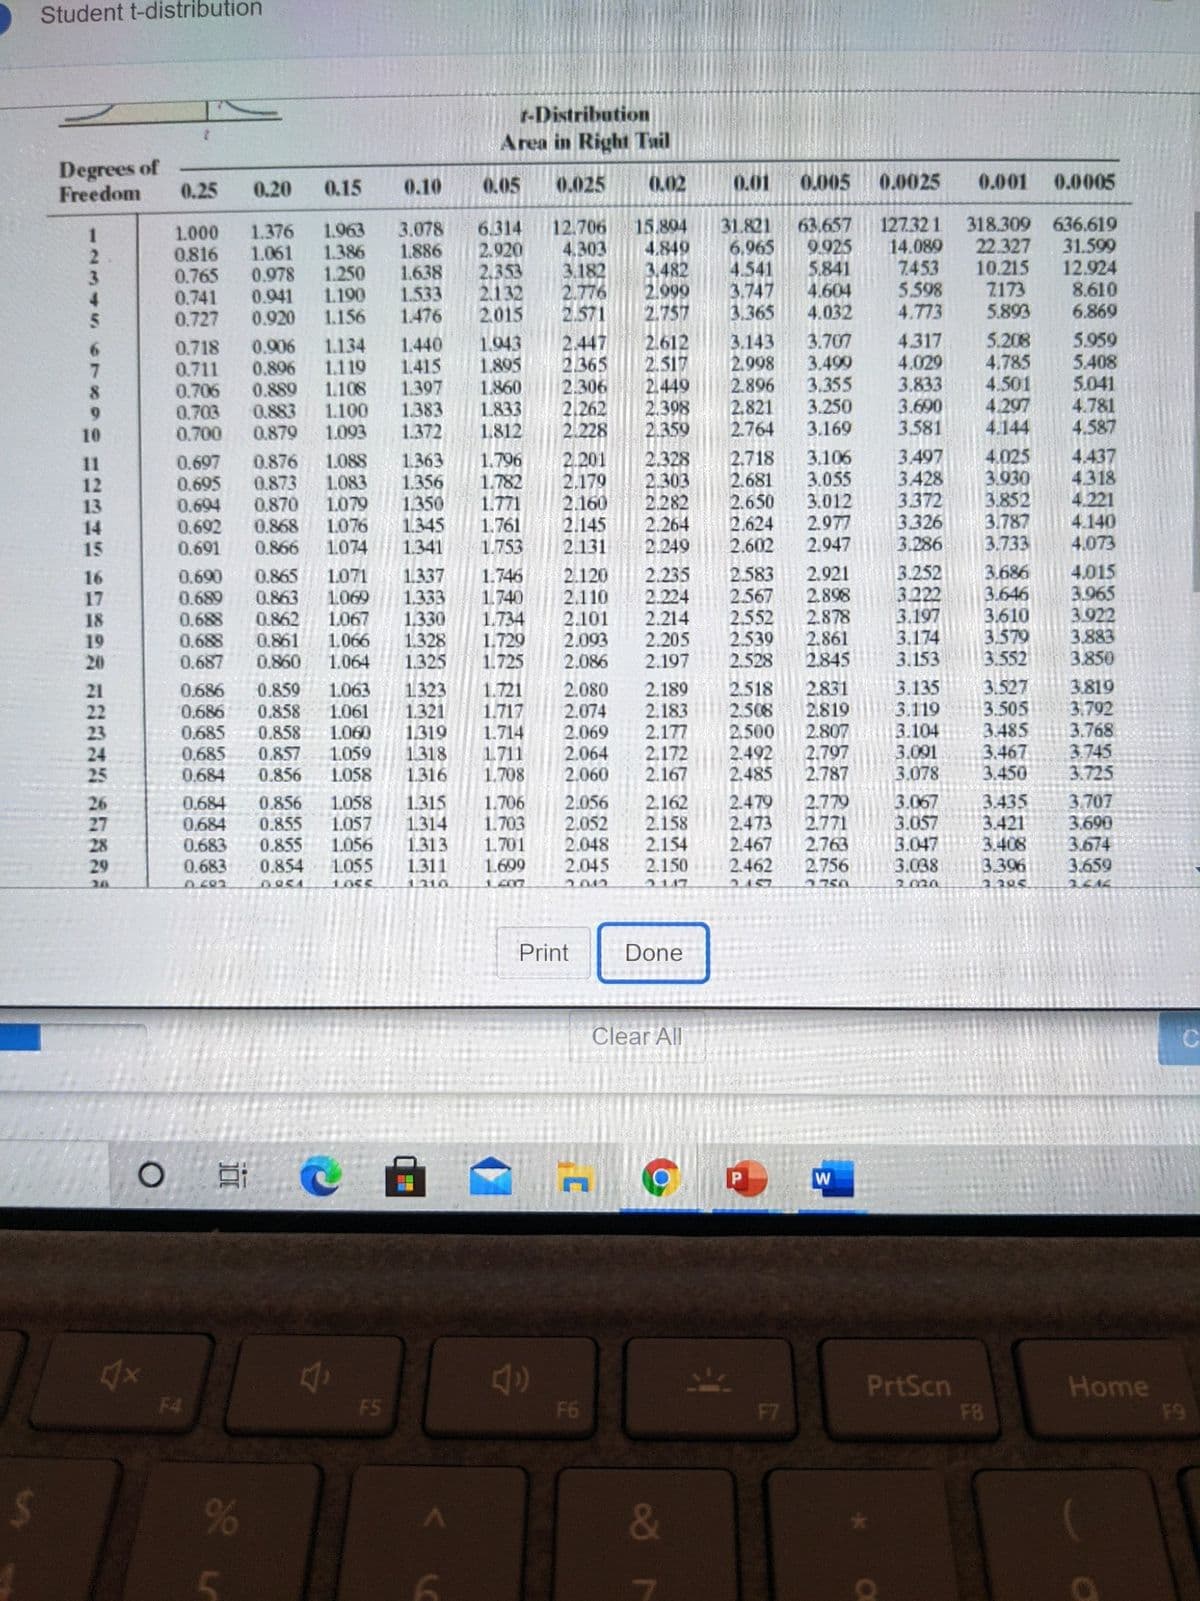
Transcribed Image Text:Student t-distribution
t-Distribution
Area in Right Tail
Degrees of
Freedom
0.25
0.20
0.15
0.10
0.05
0.025
0.02
0.01
0.005
0.0025
0.001 0.0005
1.000
0.816
0.765
0.741
0.727
1.376
1.061
0.978
0.941
0.920
1.963
1.386
1.250
1.190
1.156
3.078
1.886
1.638
1.533
1.476
6.314
2.920
2.353
2.132
2.015
12.706
4.303
3.182
2.776
2.571
15.894
4,849
3.482
2.999
2.757
31.821
6.965
4.541
3.747
3.365
63.657
9.925
5.841
4.604
4.032
127.32 1
14.089
7.453
5.598
4.773
318.309 636.619
22.327
10.215
7173
5.893
1
31.599
12.924
8.610
6.869
3.
5.959
5.408
5.041
4.781
4.587
2.612
2.517
0.718
0.711
0.706
0.703
0.700
0.906
0.896
0.889
0.883
0.879
1.134
1.119
1.108
1.100
1.093
1.440
1.415
1.397
1.383
1.372
1.943
1.895
1.860
1.833
1.812
2.447
2.365
2.306
2.262
2.228
2.449
2.398
2.359
3.143
2.998
2.896
2.821
2.764
3.707
3.499
3.355
3.250
3.169
4.317
4.020
3.833
3.690
3.581
5.208
4.785
4.501
4.297
4.144
10
1.088
1.083
1.079
1.076
1.074
1.363
1.356
1.350
2.201
2.179
2.160
2.145
2.328
2.303
2.282
2.264
2.249
2.718
2.681
2.650
2.624
2.602
3.106
3.055
3.012
2.977
2.947
3.497
3.428
3.372
3.326
3.286
4,025
3.930
3.852
3.787
3.733
4,437
4.318
4.221
4.140
4.073
1.796
11
12
13
14
15
0.697
0.695
0.694
0.692
0.691
0.876
0.873
0.870
0.868
0.866
1.782
1.771
1.761
1.753
1.345
1.341
2.131
1.337
1.333
1.330
1.328
1.325
2.235
2.224
2.214
2.921
2.898
2.878
2.861
2.845
3.252
3.222
3.197
3.174
3.153
3.686
3.646
3.610
3.579
3.552
4.015
3.965
3.922
3.883
3.850
1.746
1.740
1.071
1069
1.067
2.120
2.110
2.101
2.093
2.086
2.583
2.567
2.552
2.539
2.528
0.690
0.865
0.863
0.862
0.861
0.860
16
17
18
19
20
0.689
0.688
0.688
0.687
1.734
1.729
1.725
1.066
1.064
2.205
2.197
2.831
2.819
2.807
3.527
3.505
3.485
3.467
3.450
3.819
3.792
3.768
3745
3.725
3.135
0.859
0.858
0.858
0.857
0.856
1323
1.321
1.319
2.189
2.183
2.177
2.172
2.167
2.518
2.508
2.500
2.492
2.485
1.063
1.061
0.686
0.686
0.685
1.721
1.717
1.714
1.711
1.708
2.080
2.074
2.069
2.064
2.060
21
22
23
24
25
1.060
1.059
1.058
3.119
3.104
3.091
3.078
0.685
0.684
1318
1.316
2.797
2.787
26
27
28
29
0.684
0.684
0.683
0.683
0.856
0.855
0.855
0.854
1.058
1.057
1.056
1.055
1.315
1.314
1.313
1.311
1.706
1.703
1.701
1.699
2.056
2.052
2.048
2.045
2.162
2.158
2.154
2.150
2.479
2.473
2.467
2.462
2.779
2.771
2.763
2.756
3.067
3.057
3.047
3.435
3.421
3.408
3.396
3.707
3.690
3.674
3.659
3.038
1.210
2012
2750
20m0
2616
Print
Done
Clear All
PrtScn
Home
F9
F4
F5
F6
F7
FB
&
Transcribed Image Text:A researcher wanted to determine if carpeted or uncarpeted rooms contain more bacteria. The table shows the results for
the number of bacteria per cubic foot for both types of rooms. A normal probability plot and boxplot indicate that the data
are approximately normally distributed with no outliers. Do carpeted rooms have more bacteria than uncarpeted rooms at
the a= 0.05 level of significance?
Full data set
Carpeted
Uncarpeted
9.9
15.2
9.6
11.4
8.4
14.6
9.2
12.9
9.7
8.8
6.6
4.7
9.2
10.7
6.6
13.3
E Click the icon to view the Student t-distribution table.
What are the null and alternative hypotheses?
Expert Solution
This question has been solved!
Explore an expertly crafted, step-by-step solution for a thorough understanding of key concepts.

This is a popular solution!

Trending now
This is a popular solution!

Step by step
Solved in 3 steps

Knowledge Booster


Learn more about
Need a deep-dive on the concept behind this application? Look no further. Learn more about this topic, statistics and related others by exploring similar questions and additional content below.Recommended textbooks for you
MATLAB: An Introduction with Applications
Statistics
ISBN:
9781119256830
Author:
Amos Gilat
Publisher:
John Wiley & Sons Inc

Probability and Statistics for Engineering and th…
Statistics
ISBN:
9781305251809
Author:
Jay L. Devore
Publisher:
Cengage Learning

Statistics for The Behavioral Sciences (MindTap C…
Statistics
ISBN:
9781305504912
Author:
Frederick J Gravetter, Larry B. Wallnau
Publisher:
Cengage Learning
MATLAB: An Introduction with Applications
Statistics
ISBN:
9781119256830
Author:
Amos Gilat
Publisher:
John Wiley & Sons Inc
Probability and Statistics for Engineering and th…
Statistics
ISBN:
9781305251809
Author:
Jay L. Devore
Publisher:
Cengage Learning
Statistics for The Behavioral Sciences (MindTap C…
Statistics
ISBN:
9781305504912
Author:
Frederick J Gravetter, Larry B. Wallnau
Publisher:
Cengage Learning

Elementary Statistics: Picturing the World (7th E…
Statistics
ISBN:
9780134683416
Author:
Ron Larson, Betsy Farber
Publisher:
PEARSON

The Basic Practice of Statistics
Statistics
ISBN:
9781319042578
Author:
David S. Moore, William I. Notz, Michael A. Fligner
Publisher:
W. H. Freeman

Introduction to the Practice of Statistics
Statistics
ISBN:
9781319013387
Author:
David S. Moore, George P. McCabe, Bruce A. Craig
Publisher:
W. H. Freeman