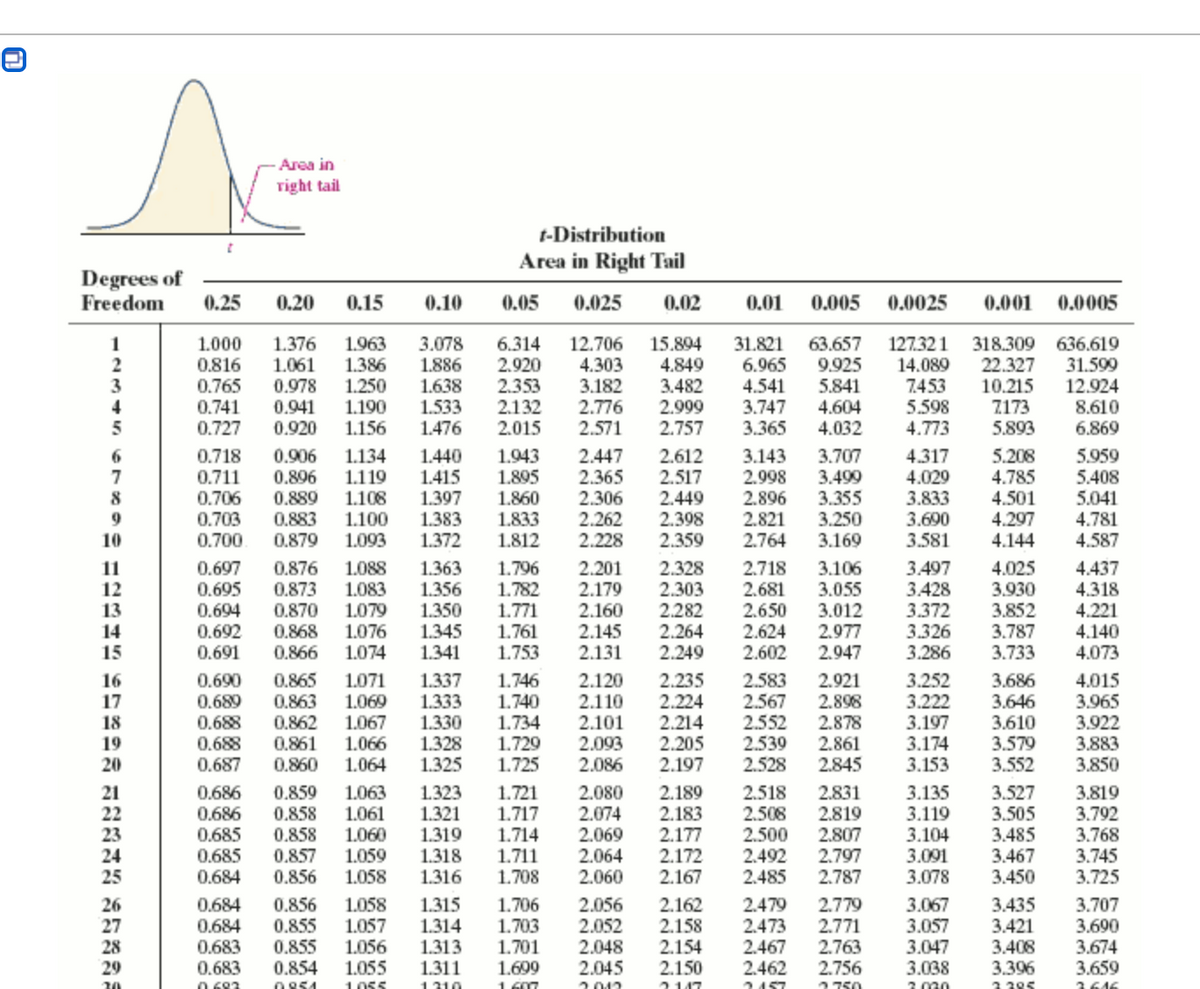
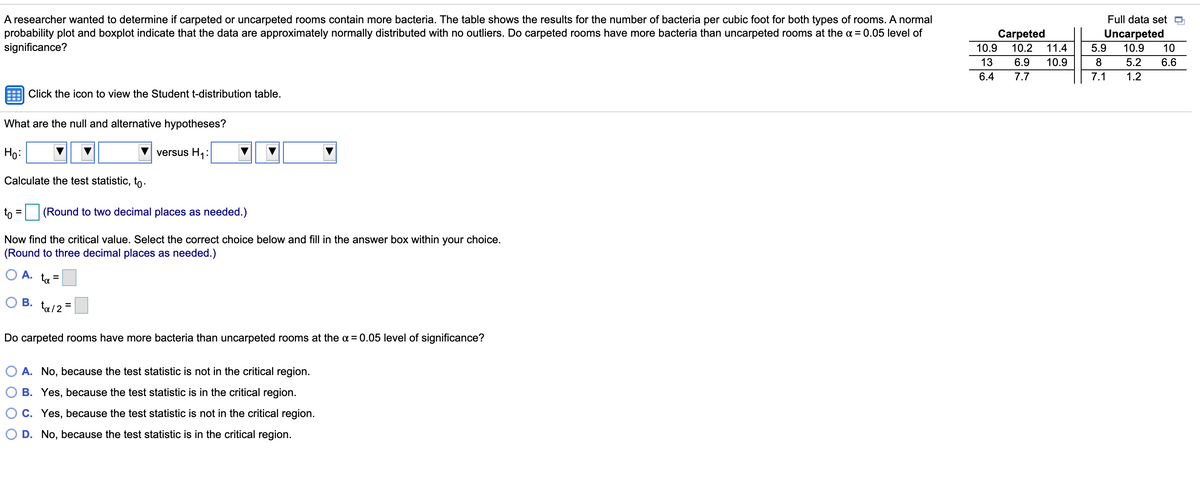
A researcher wanted to determine if carpeted or uncarpeted rooms contain more bacteria. The table shows the results for the number of bacteria per cubic foot for both types of rooms. A normal probability plot and boxplot indicate that the data are approximately normally distributed with no outliers. Do carpeted rooms have more bacteria than uncarpeted rooms at the a = 0.05 level of significance? Full data set D Carpeted Uncarpeted 5.9 10.9 8 5.2 7.1 1.2 10.9 10.2 11.4 10 13 6.9 10.9 6.6 6.4 7.7 E Click the icon to view the Student t-distribution table. What are the null and alternative hypotheses? Ho: V versus H Calculate the test statistic, to- th = (Round to two decimal places as needed.) Now find the critical value. Select the correct choice below and fill in the answer box within your choice. (Round to three decimal places as needed.) O A. ta O B. w2= Do carpeted rooms have more bacteria than uncarpeted rooms at the a = 0.05 level of significance? O A. No, because the test statistic is not in the critical region. O B. Yes, because the test statistic is in the critical region. O C. Yes, because the test statistic is not in the critical region. O D. No, because the test statistic is in the critical region.


Continuous Probability Distributions
Probability distributions are of two types, which are continuous probability distributions and discrete probability distributions. A continuous probability distribution contains an infinite number of values. For example, if time is infinite: you could count from 0 to a trillion seconds, billion seconds, so on indefinitely. A discrete probability distribution consists of only a countable set of possible values.
Normal Distribution
Suppose we had to design a bathroom weighing scale, how would we decide what should be the range of the weighing machine? Would we take the highest recorded human weight in history and use that as the upper limit for our weighing scale? This may not be a great idea as the sensitivity of the scale would get reduced if the range is too large. At the same time, if we keep the upper limit too low, it may not be usable for a large percentage of the population!

Step by step
Solved in 4 steps with 3 images


