Given the following q-values, which among the means would be in a separate cluster? XA - Xg = 15-14 = 1 XA - Xc = 15-10 = 5 Xg - Xc = 14–10 = 4 q = 1/1.016 = .984 NS q = 5/1.016 = 4.921 * q = 4/1.016 = 3.937 *
Given the following q-values, which among the means would be in a separate cluster? XA - Xg = 15-14 = 1 XA - Xc = 15-10 = 5 Xg - Xc = 14–10 = 4 q = 1/1.016 = .984 NS q = 5/1.016 = 4.921 * q = 4/1.016 = 3.937 *

MATLAB: An Introduction with Applications
6th Edition
ISBN:9781119256830
Author:Amos Gilat
Publisher:Amos Gilat
Chapter1: Starting With Matlab
Section: Chapter Questions
Problem 1P

Related questions
Question
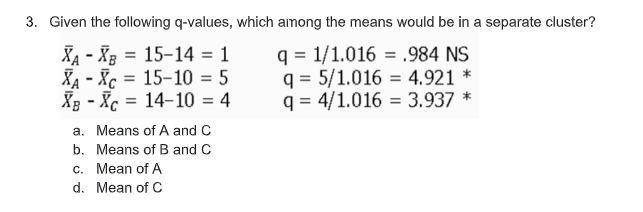
Transcribed Image Text:3. Given the following q-values, which among the means would be in a separate cluster?
XA - Xg = 15-14 = 1
XA - Xc = 15-10 = 5
XB - Xc = 14-10 = 4
q = 1/1.016 = .984 NS
q = 5/1.016 = 4,921 *
q = 4/1.016 = 3.937 *
%3D
%3D
a. Means of A and C
b. Means of B and C
c. Mean of A
d. Mean of C
Expert Solution
This question has been solved!
Explore an expertly crafted, step-by-step solution for a thorough understanding of key concepts.

Step by step
Solved in 2 steps with 1 images

Recommended textbooks for you
MATLAB: An Introduction with Applications
Statistics
ISBN:
9781119256830
Author:
Amos Gilat
Publisher:
John Wiley & Sons Inc

Probability and Statistics for Engineering and th…
Statistics
ISBN:
9781305251809
Author:
Jay L. Devore
Publisher:
Cengage Learning

Statistics for The Behavioral Sciences (MindTap C…
Statistics
ISBN:
9781305504912
Author:
Frederick J Gravetter, Larry B. Wallnau
Publisher:
Cengage Learning
MATLAB: An Introduction with Applications
Statistics
ISBN:
9781119256830
Author:
Amos Gilat
Publisher:
John Wiley & Sons Inc
Probability and Statistics for Engineering and th…
Statistics
ISBN:
9781305251809
Author:
Jay L. Devore
Publisher:
Cengage Learning
Statistics for The Behavioral Sciences (MindTap C…
Statistics
ISBN:
9781305504912
Author:
Frederick J Gravetter, Larry B. Wallnau
Publisher:
Cengage Learning

Elementary Statistics: Picturing the World (7th E…
Statistics
ISBN:
9780134683416
Author:
Ron Larson, Betsy Farber
Publisher:
PEARSON

The Basic Practice of Statistics
Statistics
ISBN:
9781319042578
Author:
David S. Moore, William I. Notz, Michael A. Fligner
Publisher:
W. H. Freeman

Introduction to the Practice of Statistics
Statistics
ISBN:
9781319013387
Author:
David S. Moore, George P. McCabe, Bruce A. Craig
Publisher:
W. H. Freeman