Ecology students are required to do a lab research project, and two students decide to study the population growth of beetles in a sack of flour (food for the beetles). They collect the following data: Week 0 NTG8024 6 10 12 14 1. Identify the independent variable 2. Identify the dependent variable Is this data discrete or continuous ? # beetles 2 80 225 275 950 1100 1100 900 3. Graph this data. Be sure to use a pencil and follow the graphing rules on page 8. 10
Ecology students are required to do a lab research project, and two students decide to study the population growth of beetles in a sack of flour (food for the beetles). They collect the following data: Week 0 NTG8024 6 10 12 14 1. Identify the independent variable 2. Identify the dependent variable Is this data discrete or continuous ? # beetles 2 80 225 275 950 1100 1100 900 3. Graph this data. Be sure to use a pencil and follow the graphing rules on page 8. 10
Biology: The Unity and Diversity of Life (MindTap Course List)
14th Edition
ISBN:9781305073951
Author:Cecie Starr, Ralph Taggart, Christine Evers, Lisa Starr
Publisher:Cecie Starr, Ralph Taggart, Christine Evers, Lisa Starr
Chapter44: Population Ecology
Section: Chapter Questions
Problem 13SQ: Match each term with its most suitable description. _____ carrying capacity a. maximum rate or...
Related questions
Question
100%
I don't have an idea how to do this hom

Transcribed Image Text:Questions for Further Thought and Review
Ecology students are required to do a lab research project, and two students decide to
study the population growth of beetles in a sack of flour (food for the beetles). They
collect the following data:
Week # beetles
0
2
4
6
8
10
12
14
1. Identify the independent variable
2. Identify the dependent variable
Is this data discrete or continuous ?
2
80
225
275
950
1100
1100
900
3. Graph this data. Be sure to use a pencil and follow the graphing rules on page 8.
10

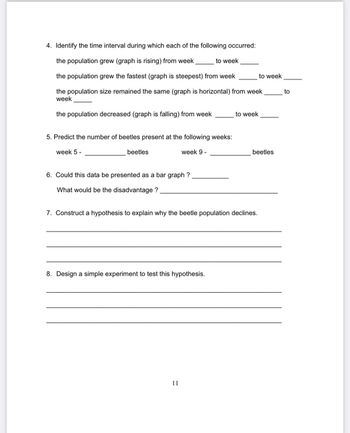
Transcribed Image Text:4. Identify the time interval during which each of the following occurred:
the population grew (graph is rising) from week
the population grew the fastest (graph is steepest) from week
the population size remained the same (graph is horizontal) from week
week
the population decreased (graph is falling) from week
5. Predict the number of beetles present at the following weeks:
week 5 -
week 9 -
beetles
6. Could this data be presented as a bar graph ?
What would be the disadvantage ?
to week
8. Design a simple experiment to test this hypothesis.
11
to week
7. Construct a hypothesis to explain why the beetle population declines.
to week
beetles
to
Expert Solution
Step 1
Introduction :
In an algebraic equation, an independent variable describes a variable whose values are independent of changes.
The dependent variable is characterized as the variable whose quality depends on the estimation of another variable in its condition.
Trending now
This is a popular solution!
Step by step
Solved in 2 steps with 1 images

Follow-up Questions
Read through expert solutions to related follow-up questions below.
Follow-up Question

Transcribed Image Text:4. Identify the time interval during which each of the following occurred:
the population grew (graph is rising) from week
the population grew the fastest (graph is steepest) from week
the population size remained the same (graph is horizontal) from week
week
the population decreased (graph is falling) from week
5. Predict the number of beetles present at the following weeks:
week 5 -
week 9 -
beetles
6. Could this data be presented as a bar graph ?
What would be the disadvantage ?
to week
8. Design a simple experiment to test this hypothesis.
11
to week
7. Construct a hypothesis to explain why the beetle population declines.
to week
beetles
to
Solution
Knowledge Booster
Learn more about
Need a deep-dive on the concept behind this application? Look no further. Learn more about this topic, biology and related others by exploring similar questions and additional content below.Recommended textbooks for you

Biology: The Unity and Diversity of Life (MindTap…
Biology
ISBN:
9781305073951
Author:
Cecie Starr, Ralph Taggart, Christine Evers, Lisa Starr
Publisher:
Cengage Learning

Biology: The Dynamic Science (MindTap Course List)
Biology
ISBN:
9781305389892
Author:
Peter J. Russell, Paul E. Hertz, Beverly McMillan
Publisher:
Cengage Learning

Biology: The Unity and Diversity of Life (MindTap…
Biology
ISBN:
9781305073951
Author:
Cecie Starr, Ralph Taggart, Christine Evers, Lisa Starr
Publisher:
Cengage Learning

Biology: The Dynamic Science (MindTap Course List)
Biology
ISBN:
9781305389892
Author:
Peter J. Russell, Paul E. Hertz, Beverly McMillan
Publisher:
Cengage Learning