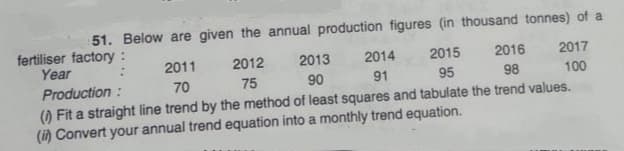
51. Below are given the annual production figures (in thousand tonnes) of a fertiliser factory: Year 2011 2012 2013 2014 2015 2016 2017 Production : 70 75 90 91 95 98 100 () Fit a straight line trend by the method of least squares and tabulate the trend values. (in Convert your annual trend equation into a monthly trend equation.


Q: 3. Jin Hit Corporation is in the business of smart TV's. They wanted to forecast their demand for…
A: Given that, Jin Hit Corporation is in the business of smart TV's. They wanted to forecast their…
Q: n-30, ΣΧ-15, ΣΥ-30, Σιy30 , ΣΣ10, Σε26.934, Σy- 160.
A: Regression analysis: A simple linear regression equation for the dependent variable Y and the…
Q: 3.29 The quarterly revenues of a small medical supply company for the last several years (27…
A: Note: As per the guidelines, we are solving first three subparts for you. Please repost the complete…
Q: he owner of Showtime Movie Theaters, Inc., would like to predict weekly gross revenue as a function…
A: Let y be the weekly gross revenue x1 be the amount of television advertising Excel Procedure: Enter…
Q: 16. High blood pressure in men. a) Choose two points from the following data and find a linear…
A: Given, The data is,
Q: using the data from the images, compare and analyze the trends shown on the graphs and relate them…
A: Given information: Histogram for the variables bright weight and gestational period.
Q: A merchant's sale (*00s tons) of ordinary coal over a period were as shown below: Quarters Years I…
A: Given, Quarters Years 1 2 3 4 2011 118 87 47 83 2012 94 73 41 68 2013 73 61 36 56
Q: The annual production of a commodity is given by as follows: Year 2005 2006 2007 2008 2009 2010 2011…
A:
Q: Below given are the figures of production (in thousand tonnes) of coal mine : Year 2002 2004 : 2005…
A:
Q: Q. 4 Fit a straight line trend by the method of least squares and obtain the trend values from the…
A:
Q: Anita Limited has shared their annual sales revenue over the last 6 financial years from 2015 to…
A: a) Using linear trend equation forecast the sales revenue of Anita Limited for 2021 For a linear…
Q: Fit a straight line trend by the method of least squares and estimate the sales for 2004 and 2005,…
A: Given:
Q: In this table, x represents the number of years that have passed since 1975. For example, an x-value…
A: The independent variable is x. The dependent variable is y. We have to predict the profit in the…
Q: Find the trend line equation and obtain the trend values for the followin data using the method of…
A:
Q: The equation for yearly sales (in '000) for a commodity with year 2000 as origin is Y = 91.6…
A: Introduction In this question we have to Determine the trend equation to given monthly trend values…
Q: Can someone explain this from a mathematical perspective? Find a relation between the fraction of…
A: Given :- A relation between the fraction of islands occupied by a species and time. There is a fixed…
Q: Determine the equation of the trend line for the data shown below on Canadian balance of payments…
A:
Q: * For the following table: () Fit a straight line trend by the method of least squares. (ii)…
A:
Q: Dehoratius Electronics Inc. wants to understand what will be the demand for their product Ezer for…
A: Compute the regression equation: Simple linear regression model: A simple linear regression model is…
Q: Q4. By plotting the graph of the given data mention whether there is a positive trend, negative…
A:
Q: The table below shows the revenue in billion dollars at theme parks in a certain country. Make a…
A: Use the excel to draw the trend line:
Q: Anita Limited has shared their annual sales revenue over the last 6 financial years from 2015 to…
A: For Using linear trend equation to forecast the sales revenue of Anita Limited for 2021, we have to…
Q: The percent of 10th grade students who have smoked frequently in the last 30 days has greatly…
A: Average rate of change is calculated as change in quantity by change in time.
Q: The number of married people in a country (in millions) and the total number of adults in the…
A: Given: Year Married Total 1990 113.0 190.5 1997 115.2 204.9 2000 121.1 215.9 2007 125.7…
Q: Which of the following best describes the trend of the graph? Scatterplot of Salary vs Start Year…
A: Scatterplot is a graphical representation between two variables, where each of the points of the…
Q: Fit a straight line trend by the method of least squares to the following data and calculate trend…
A:
Q: Example 18.15 The trend equation for annual sales of a product is- Y = 102 + 36 X with 1st January…
A:
Q: Below are given the annual production figures (in thousand tonnes) Fertiliser factory: Year 2011…
A:
Q: 11.9. The trend equation fitted to a series of sales data is given by Y = 1600 + 200X 's
A:
Q: Fit a trend function y = A. Bx to the following data. 2 3 4 5 y : 1.6 4.5 13.8 40 2 125.0
A:
Q: Anita Limited has shared their annual sales revenue over the last 6 financial years from 2015 to…
A: 1.
Q: (a) You are given the following trend equation by the method of least squares of a company selling…
A:
Q: Q3 A manufacturer has plotted product sales over the past four weeks. Use a linear trend line to…
A:
Q: 7. The work of an epidemiologist is to investigate the root cause of a disease and determine the…
A:
Q: The quarterly earnings of a large soft drink company have been recorded for the period 2014 - 2017.…
A: Seasonal variations are the cyclic changes in the time series that occur regularly each year.
Q: An analyst must decide between two different forecasting techniques for weekly sales of roller…
A:
Q: fllustration 12.11. Given below are the figures of production in thousand quintals of a sugar…
A:
Q: Determine the equation of the trend line for the data shown below on Canadian balance of payments…
A: The regression equation is given as : y=a+bx, where a is the intercept (value of Y when X is zero)…
Q: The following table shows the number of people in the U.S. living in various years. Year Number with…
A:
Q: 12. Fit a straight line trend by the method of least squares to the following data. Assuming that…
A:
Q: The following time series shows the sales of supermarket chain over the last six months. Month…
A: Given the sales of supermarket chain over the last six months as Month Sales ($ 000)…
Q: The following table shows the number of people in the U.S. living in various years. Year Number with…
A: Solution
Q: squares from the data given below and estimate the sales for 1983: Calculate trend values by the…
A:
Q: Below are given the annual production figures (in thousand tonnes) of a fertiliser factory: Year…
A: Solution :-
Q: The table below is the number of employees owned by Islamic Commercial Banks (BUS) in 2011 – 2020…
A: Regression analysis: Linear Regression analysis is used to measure the association (or) linear…
Q: Fit a straight line trend by the method of least squares to the following data. Assuming that the…
A: The least square regression line is the straight line which relate the dependent variable y with…
Q: Anita Limited has shared their annual sales revenue over the last 6 financial years from 2015 to…
A: a) Using linear trend equation forecast the sales revenue of Anita Limited for 2021 For a linear…
Q: The analysis of Earnings Per Share (EPS) is as follows: 2015: $5.70 2016: $3.30 2017: $6.21 2018:…
A: Given: The provided data is: Year Earning Per Share (EPS) (in $) 2015 5.70 2016 3.30 2017…

Step by step
Solved in 2 steps with 2 images

- The correlation coefficient between the yearly returns of two mutual funds is 0.20. What does that mean about the strength and direction of the linear relationship between the returns of the two funds?The relationship between sleep hours and overall happiness level on the next day was estimated as below in a linear format. (Happiness level is measured through a five-point scale: 1 = Extremely unhappy, 5 = Extremely happy) Overall happiness level = 0.27 * Sleep hours + 2.34 (The p-value for the coefficient of Sleep hours is 0.02.) Based on this equation, what is the expected happiness level of a person on a certain day, when he slept 7 hours the day before?A) What is the purpose of the “callout bubble” in the bottom right-hand corner of the graph, showing a tiny red square inside the yellow square? Why do you suppose the author felt the need to use a callout bubble? B) Data from this source show that the rate of symptomatic infection with COVID for people who have been vaccinated is about 100 infections per 102,000 vaccinations. As of July 30, 2021, data show that164,000,000 Americans have been fully vaccinated. How many of these vaccinated Americans would be expected to become infected with COVID and display symptoms? C) Data from this source show that the rate of death from COVID for people who have been vaccinated is about 1 death per 102,000 vaccinations. As of July 30, 2021, data show that 164,000,000 Americans have been fully vaccinated. How many of these vaccinated Americans would be expected to die from COVID?
- The manager of a popular tourist resort wants to use the manual trend projection forecasting technique and exponential smoothing without trend to forecast room occupancy at the resort for the next 4 years. Using numerical example, demonstrate how these techniques can be used to do the forecast.Are the data displayed in the graph above discrete or continuous? What is the level of measurement of the data? Are the data above time series or cross-sectional data? Examine the data for each race/ethnicity group. Do the data represent a stationary or nonstationary process? Do any of the race/ethnicity groups exhibit a decreasing trend? Do any of the race/ethnicity groups show a strictly increasing trend over the entire time period from 2000 to 2016?The table given below indicates Small Holding Ltd.’s quarterly profits in 2019 and2020.Time Period Profit (Thousands Of Rands)2019 Q12019 Q22019 Q32019 Q42020 Q12020 Q22020 Q32020 Q4250210165195265218178204Q.6.3.1 Determine the trend regression function for this data set. In order toobtain full marks for this question, you must complete the relevanttable (template provided below) and then apply the appropriate timeseries formulae in the formulae sheet.
- The following gives the number of accidents that occured on Floridaq State highway 101 during the last 4 months" month jan feb mar apr # of accidents 30 45 60 95 Using the least-squares regression method the trend equation for forecasting is (round your responses to two decimal places): ^Y=[__]+[___]XA prospective cohort study is run to estimate the incidence of stroke in persons 55 years of age and older. All participants are free of stroke at study start. Each participant is followed for a maximum of 5 years. The data are summarized in Table 3–14. Number of Strokes Number of Stroke-Free Person-Years Men (n = 125) 9 478 Women (n = 200) 21 97 What is the annual incidence rate of stroke in men? What is the annual incidence rate of stroke in women? What is the annual incidence rate of stroke (men and women combined)?what is meant by the term “residual”?
- Based on the given sales volume of AZ’s sanitizer product for 16 weeks, construct the trend projection using graphs, 3 weeks moving average, and exponential smoothing methods. Weeks Sanitizer sales 1 5600 2 5200 3 4570 4 4305 5 5465 6 8900 7 15680 8 24680 9 35040 10 36500 11 38575 12 35300 13 35200 14 35150 15 34950 16 345005. When the Pearson Product Moment Correlation is equal to -0.68, there is a ______ linear trend.The table given below indicates New Holding Ltd.’s quarterly profits in 2019 and 2020.Time Period Profit (Thousands Of Rands)2019 Q1 2502019 Q2 2102019 Q3 1652019 Q4 1952020 Q1 2652020 Q2 2182020 Q3 1782020 Q4 204 Determine the trend regression function for this data set. Given that the typical seasonal index for Q3 is 87.3, use this informationand the trend regression function obtained to determine theseasonally adjusted trend estimate for profits in Q3 of 2022.