Q3 A manufacturer has plotted product sales over the past four weeks. Use a linear trend line to generate a forecast for week 5. T (week) Y (Sales) 1 2300 2 2400 3 2200 4 2600
Q3 A manufacturer has plotted product sales over the past four weeks. Use a linear trend line to generate a forecast for week 5. T (week) Y (Sales) 1 2300 2 2400 3 2200 4 2600

Chapter4: Linear Functions
Section4.3: Fitting Linear Models To Data
Problem 22SE: The U.S. Census tracks the percentage of persons 25 years or older who are college graduates. That...

Related questions
Question
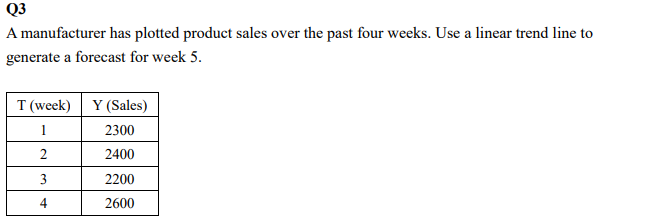
Transcribed Image Text:Q3
A manufacturer has plotted product sales over the past four weeks. Use a linear trend line to
generate a forecast for week 5.
T (week)
Y (Sales)
1
2300
2
2400
3
2200
4
2600
Expert Solution
This question has been solved!
Explore an expertly crafted, step-by-step solution for a thorough understanding of key concepts.

Step by step
Solved in 2 steps with 2 images

Recommended textbooks for you

Glencoe Algebra 1, Student Edition, 9780079039897…
Algebra
ISBN:
9780079039897
Author:
Carter
Publisher:
McGraw Hill

Glencoe Algebra 1, Student Edition, 9780079039897…
Algebra
ISBN:
9780079039897
Author:
Carter
Publisher:
McGraw Hill

Functions and Change: A Modeling Approach to Coll…
Algebra
ISBN:
9781337111348
Author:
Bruce Crauder, Benny Evans, Alan Noell
Publisher:
Cengage Learning

Big Ideas Math A Bridge To Success Algebra 1: Stu…
Algebra
ISBN:
9781680331141
Author:
HOUGHTON MIFFLIN HARCOURT
Publisher:
Houghton Mifflin Harcourt

Trigonometry (MindTap Course List)
Trigonometry
ISBN:
9781337278461
Author:
Ron Larson
Publisher:
Cengage Learning