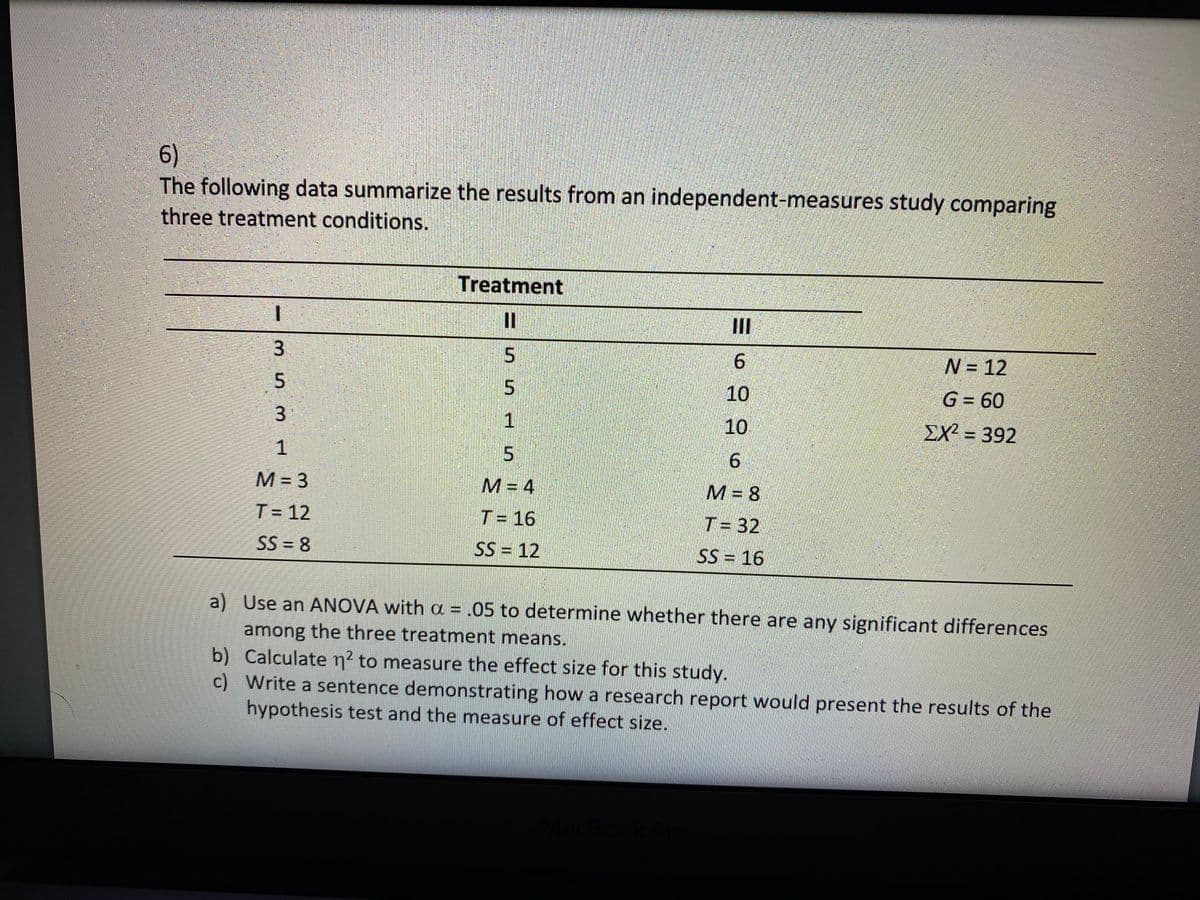
6) The following data summarize the results from an independent-measures study comparing three treatment conditions. Treatment II II 3. N = 12 10 G = 60 3 1 10 ΣΧ392 1 6. M = 3 M = 4 M = 8 T= 12 T= 16 T = 32 SS = 8 SS = 12 SS = 16 %3D


Q: Now assume that the data are from a repeated- measures study using the same sample of n = 6…
A: (A)
Q: Recently, researchers have begun to focus on the relationship between potentially toxic…
A: (A) The hypotheses are given below: Null hypothesis: H0:ρ=0 Alternative hypothesis: H1:ρ≠0…
Q: An artide in the IEEE Transactions on Components, Hybrids, and Manufacturing Technology (Vol. 15,…
A:
Q: Q1: The effect of three different lubricating oils on fuel economy in truck engines is being…
A: NOTE: As per the guidelines, we are supposed to solve first 3 sub parts only. Given: Different…
Q: An artide in the IEEE Transactions on Components, Hybrids, and Manufacturing Technology (Vol. 15,…
A:
Q: Exposure to microbial products, especially endotoxin, may have an impact on vulnerability to…
A: Given information: The data represents the Endotoxin concentration values of Urban homes and Farm…
Q: The following information is obtained from two independent samples selected from two populations. n…
A: Given,n1=250n2=240x¯1=5.35x¯2=4.42σ1=1.65σ2=1.63
Q: 4. Set up the null and alternative hypotheses to test whether there is any difference between the…
A:
Q: Recall the study, reported in Exercise 7.8.1, in which Dora et al. (A-37), investigated spinal canal…
A:
Q: Which of the following research ideas will be best for using a cross- sectional research design? To…
A: Cross sectional study is observational research design involve analysing the data from population at…
Q: The following data are from an experiment comparing three different treatment conditions. A B C…
A: Given data are from an experiment comparing three different treatment conditions.
Q: An artide in the IEEE Transactions on Components, Hybrids, and Manufacturing Technology (Vol. 15,…
A: given
Q: An artide in the IEEE Transactions on Components, Hybrids, and Manufacturing Technology (Vol. 15,…
A: given data
Q: 3. The measured soil water content of 16 samples at four depths is as follows: Soil Water contents (…
A:
Q: 9. Given the linear correlation coefficient r and the sample size n, determine the critical values…
A: The level of significance is 0.05.
Q: An experiment was designed to test for any significant differences in the time needed to perform…
A: An ANOVA is a statistical tool used to test the population mean of two or more than two groups.…
Q: A regression analysis involved 17 independent variables and 685 observations. If SSE = 500 and SSR =…
A: A regression analysis involved 17 independent variables and 685 observations. SSE = 500 and SSR =…
Q: a. An experiment to compare the tension bond strength of polymer lates modified mortar to that of…
A: Following are the Explanation of the question Use the Two sample Z test to Compare the two groups of…
Q: Given are five observations collected in a regression study on two variables. 2 6 9 13 20 7…
A: Let first variable represents independent variable (x) and second variable (y) represents response…
Q: The data below are from an independent-measures experiment comparing three different treatment…
A: Given K=3 no of treatment n=12 no of observation
Q: 1. A new drug for pain relief is being tested within a given palliative care population. The new…
A: From the given information,
Q: The following data are from an experiment comparing three different treatment conditions…
A: Note: Hey there! Thank you for the question. As you have posted a question with multiple sub-parts,…
Q: The data below are from an independent-measures experiment comparing three different treatment…
A: The following information has been given: Treatment 1 Treatment 2 Treatment 3 0 1 4 0 4 3 0…
Q: Given the linear correl ation coefficient r and the sample size n, determine the critical values of…
A: Given : r = -0.466 n = 15
Q: 1. A new drug for pain relief is being tested within a given palliative care population. The new…
A: Given information: Pain Rating as Reported by Patients Old Drug 1…
Q: Is there any significant difference in the impact of procrastination in academic performance of the…
A: Given information: STRONGLY AGREE AGREE DISAGREE STRONGLY DISAGREE Total ABM 11 21 30 23 85…
Q: given normally distributed sample x=12 and s=3, use the Empirical Rule determine the upper and lower…
A: According to the empirical rule,
Q: Based on the data below, the Cronbach’s alpha coefficient is Subject Item 1 Item 2 Item 3 Item 4…
A:
Q: The better-selling candies are often high in calories. Assume that the following data show the…
A: Given Information: The data represents the calorie content from samples of M&M's, kit Kat and…
Q: Q. 3 Following data present the effects of gasoline fume exposure on respiratory illness among…
A: risk ratio and rate ratio have to be found with interpretations.
Q: The data below are from an independent-measures experiment comparing three different treatment…
A: Given Treatment 1 Treatment 2 Treatment 3 0 1 4 0 4 3 0 1 6 2 0 3
Q: 1. Prepare 1 problem for each of the following tests: a. T-test 1 population b. Z-test for…
A:
Q: Based on the Exercise 6.2(3), test the hypothesis concerning H, : B = 2 against the H : B, #2 at the…
A:
Q: Are nursing salaries in City A lower than those in City B? As reported by a newspaper, salary data…
A: From the provided information,
Q: An article reported data from a study in which both a baseline gasoline mixture and a reformulated…
A: Scatter plot: Excel Procedure: Enter the Age and Baseline in Excel>Select the Age and…
Q: Consider the following measurements of blood hemoglobin concentrations (in g/dL) from three human…
A: Test hypotheses: There are 3 populations. Denote the true mean of each of the 3 populations as μ1,…
Q: 4.13 The effect of three different lubricating oils on fuel economy in diesel truck engines is being…
A:
Q: The quality control department of a fabric finishing plant is studying the effects of several…
A: Given :
Q: The yields of a genetically-modified whieat in bushels per acre) were compared for five different…
A: The given data is the, Variety 1 2 3 4 5 A 35.3 31 32.7 36.8 37.2 B 30.7 32.2 31.4 31.7 35…
Q: Consider the following 2 × 2 table from a hypothetical cohort study. Calculate the relative risk of…
A: Introduction: Relative risk is defined as the ratio of the probability of an event of interest in…
Q: The removal of ammoniacal nitrogen is an important aspect of treatment of leachate at landfill…
A: a. The null hypothesis assumes that the mean rates of removal for the five treatments do not vary,…
Q: The following data were obtained from an independent-measures study comparing three treatment…
A: Tukey's HSD test is used when at least one group differs from the rest of the groups. The test…
Q: 3. The data below are the fuel consumption in liters per hour of two different fuels based from the…
A: Given: Treatments I II III Petro Diesel 1.49 1.49 1.26 Coco Diesel 1.38 1.33 1.33
Q: The following data are from a repeated-measures study comparing two treatment conditions. Complete…
A: Given, the repeated-measure study comparing two treatment conditions. No. of observation n=6 xi…
Q: Identify the study design best suited for the article: Antibacterial effects of Psidium guajava…
A: Hello! As you have posted 2 different questions, we are answering the first question (22). In case…
Q: 1. A researcher would like to compare the acidity level of five brands of yogurt that being sold in…
A: Note: As per guidelines we will solve the first question only, please repost other questions for…
Q: In an experiment to determine which of the three different missile systems is preferable, the…
A: Kruskal wallis test is the type of non parametric test. It is an alternative test for one way anova.…
Q: The data below are from an independent-measures experiment comparing three different treatment…
A: Given table :
Q: 2. The following data were obtained from an independent-measures study comparing three treatment…
A: The ANOVA is used to compare the significant mean difference between more than two population…
Q: QUESTION 11 An express delivery service company recently conducted a study to investigate the…
A: The problem can be solved using the concept of regression. as requested, i have attached handwritten…


Trending now
This is a popular solution!

Step by step
Solved in 3 steps with 1 images


- One critique of sentencing research is that it generally focuses on the differences between white defendants and defendants of color and rarely examines differences between minority groups. The JDCC data set can be used to test for differences between the sentences received by black and Hispanic juveniles convicted of property crimes. Black juveniles (Sample 1; N = 229) were sentenced to a mean of 31.09 months of probation (s = 15.42), and Hispanic juveniles (Sample 2; N = 118) received a mean of 40.84 months (s = 16.45). Using an alpha level of .01, test the hypothesis that there is a statistically significant difference between the two group means. Assume unequal population variances. Use all five steps.The director of an obesity clinic in a large northwestern city believes that drinking soft drinks contribute to obesity in children. To determine whether a relationship exists between these two variables, she conducts the following pilot study. Eight- 12-year-old male volunteers are randomly selected from children attending a local junior high school. Parents of the children are asked to monitor the number of soft drinks consumed by their child over a one week period. The children are weighed at the end of the week and their weights converted into body mass index (BMI) values. The BMI is a common index used to measure obesity and takes into account both height and weight. An individual is considered obese if they have a BMI value 30. The following data or collected: child. # of soft drinks consumed BMI 1 3 20 2 1 18 3…he table below summarizes baseline characteristics of patients participating in a clinical trial. a) Are there any statistically significant differences in baseline characteristics between treatments groups? Justify your answer. characteristic placebo(n=25) Experimental(n=125) p Mean 54 +/- 4.5 53+/-4.9 .7856 % female 39% 52% 0.0289 %less than HS education 24% 22% 0.0986 %completing HS 37% 36% %completing some college 39% 42% Mean(Sd SBP 136+/-13.8 134+/-12.4 0.4736 Mean Sd. total cholesterol 214+/-24.9 210+/-23.1 0.8954 %current smokers 17% 15% 0.5741 %…
- Researchers compared protein intake among three groups of postmenopausal women: (1) women eating a standard American diet (STD), (2) women eating a lactoovo- vegetarian diet (LAC), and (3) women eating a strict vegetarian diet (VEG). The mean ± 1 sd for protein intake (mg) is presented in Table 12.29. 12.4 Suppose that in the general population, 70% of vegetarians are lacto-ovo-vegetarians, whereas 30% are strict vegetarians. Perform a statistical procedure to test whether the contrast L = 0.7y2 + 0.3y3 − y1 is significantly different from 0. What does the contrast mean?12.5 Using the data in Table 12.29, perform a multiplecomparisons procedure to identify which specific underlying means are different.Researchers compared protein intake among three groups of postmenopausal women: (1) women eating a standard American diet (STD), (2) women eating a lactoovo-vegetarian diet (LAC), and (3) women eating a strict vegetarian diet (VEG). The mean ± 1 sd for protein intake (mg) is presented in Table 12.29. *12.4 Suppose that in the general population, 70% of vegetarians are lacto-ovo-vegetarians, whereas 30% are strict vegetarians. Perform a statistical procedure to test whether the contrast L y = + 07 03 2 3y y − 1 . . is significantly different from 0. What does the contrast mean? 12.5 Using the data in Table 12.29, perform a multiple comparisons procedure to identify which specific underlying means are different.Following is the rating of marketing aggressivity (X) and sales performance (Y) of 8 sales staffs in Glovis Co in the past year: Table Attached Question: What is the hypothesis of the study?
- The following data are from a research study comparing two treatment conditions. Do the data indicate a significant difference between treatments? Use a two-tailed test with α = .05. First, assume the data are from an independent-measures study using two separatesamples - and perform a complete HT, and write an APA summary, and find the CI for the difference between the means. Second, assume the data are from a repeated-measures study using the same sample ofn = 5 participants in both treatments - and perform a complete HT, and write an APA summary, and find the CI for the difference between the means. Explain why the 2-point mean difference is reliable for one test but not for the other. Control102I157Treatment11521893) A firm in Lebanon has developed a chemical solution that can be added to car gasolinewhich they believe will increase the miles per gallon that cars will get. The owners areinterested in estimating the difference between mean mpg for cars using the chemicalsolution versus those that are not using the solution. The following data represent the mpgfor independent random samples of cars from each population.with Solution without Solution______________________________n1 = 36 n2 = 42 x1 = 25.45 x2 = 24.1 _______________________________Assume that the populations are normally distributed and the population standarddeviations are known to be σ1 = 3.95 (with solution) and σ2 = 3.09 (without solution).Given this data, can the owners believe that there is a difference between mean mpg forcars using the chemical solution versus those that are not using the solution? Test using analpha level equal to 0.05.4) Given the following null and alternative hypothesis:H0: σ 2 ≤ 52HA : σ 2 > 52and the…The following data were obtained from an independent-measures study comparing three treatment conditions. Calculate the sample variance for each of the three samples. Use an ANOVA with α=.05 to determine whether there are any significant differences among the three treatment means.
- Consider a scenario where two vaccines have been developed and their effectiveness was tested by comparing the mean outcome for a vaccinated group to the mean for a control (placebo) group. Both of the vaccine studies set the significance (α) level for the test at .05, two-tailed, and both found statistically significant differences (i.e., the p-value was very small and H0 was rejected). The results were as follows: Study Effect size (d) t-statistic Vaccine 1 0.7 4.8 Vaccine 2 0.2 4.8 (a) Based on the above information, can we know whether one study involved a larger sample size than the other? If so, which one? Explain. (b) Based on the above information, can we conclude that one vaccine is preferable to (i.e., more effective than) the other? If so, which one? Explain.. The term sample usually refers to a sample that ___ - Consists of people with chemical dependency problems - Uses the same group of individuals with a before/after measurement - Requires a dependent variable for hypothesis testing - Is randomly selected from two dependent populationsA researcher conducted a repeated measures study comparing three treatment conditions. Refer to attached images and tale to answer a to d. Mean Std. Deviation N Treatment I 1.00 1.414 5 Treatment II 5.00 2.345 5 Treatment III 6.00 1.581 5 In APA format, report the F-ratio related to the treatment effect: Is this treatment effect significant? What is the partial η2 value for the treatment effect? Is this a weak, moderate, or strong effect?