The removal of ammoniacal nitrogen is an important aspect of treatment of leachate at landfill sites. The rate of removal (in percent per day) is recorded for several days for each of several treatment methods. The results are presented in the following table. (Based on the article "Removal of Ammoniacal Nitrogen from Landfill Leachate by Irrigation onto Vegetated Treatment Planes," S. Tyrrel, P. Leeds-Harrison, and K. Harrison, Water Research, 2002:291–299.) Treatment Rate of Removal 5.21 4.65 5.59 2.69 7.57 5.16 6.24 5.94 6.41 6.85 9.18 4.94 4.04 3.29 4.52 3.75 Construct an ANOVA table. You may give a range for the P-value. Can you conclude that the treatment methods differ in their rates of removal? a. b. ABCAE
The removal of ammoniacal nitrogen is an important aspect of treatment of leachate at landfill sites. The rate of removal (in percent per day) is recorded for several days for each of several treatment methods. The results are presented in the following table. (Based on the article "Removal of Ammoniacal Nitrogen from Landfill Leachate by Irrigation onto Vegetated Treatment Planes," S. Tyrrel, P. Leeds-Harrison, and K. Harrison, Water Research, 2002:291–299.) Treatment Rate of Removal 5.21 4.65 5.59 2.69 7.57 5.16 6.24 5.94 6.41 6.85 9.18 4.94 4.04 3.29 4.52 3.75 Construct an ANOVA table. You may give a range for the P-value. Can you conclude that the treatment methods differ in their rates of removal? a. b. ABCAE

Glencoe Algebra 1, Student Edition, 9780079039897, 0079039898, 2018
18th Edition
ISBN:9780079039897
Author:Carter
Publisher:Carter
Chapter10: Statistics
Section10.6: Summarizing Categorical Data
Problem 31PPS

Related questions
Question
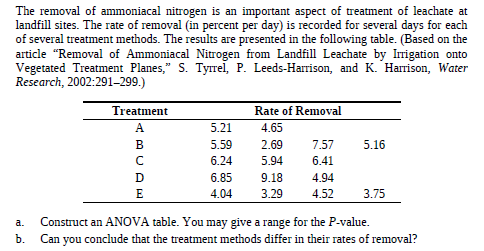
Transcribed Image Text:The removal of ammoniacal nitrogen is an important aspect of treatment of leachate at
landfill sites. The rate of removal (in percent per day) is recorded for several days for each
of several treatment methods. The results are presented in the following table. (Based on the
article "Removal of Ammoniacal Nitrogen from Landfill Leachate by Irrigation onto
Vegetated Treatment Planes," S. Tyrrel, P. Leeds-Harrison, and K. Harrison, Water
Research, 2002:291–299.)
Treatment
Rate of Removal
5.21
4.65
5.59
2.69
7.57
5.16
6.24
5.94
6.41
6.85
9.18
4.94
4.04
3.29
4.52
3.75
Construct an ANOVA table. You may give a range for the P-value.
Can you conclude that the treatment methods differ in their rates of removal?
a.
b.
ABCAE
Expert Solution
This question has been solved!
Explore an expertly crafted, step-by-step solution for a thorough understanding of key concepts.

This is a popular solution!

Trending now
This is a popular solution!

Step by step
Solved in 2 steps with 2 images

Recommended textbooks for you
Glencoe Algebra 1, Student Edition, 9780079039897…
Algebra
ISBN:
9780079039897
Author:
Carter
Publisher:
McGraw Hill
Glencoe Algebra 1, Student Edition, 9780079039897…
Algebra
ISBN:
9780079039897
Author:
Carter
Publisher:
McGraw Hill