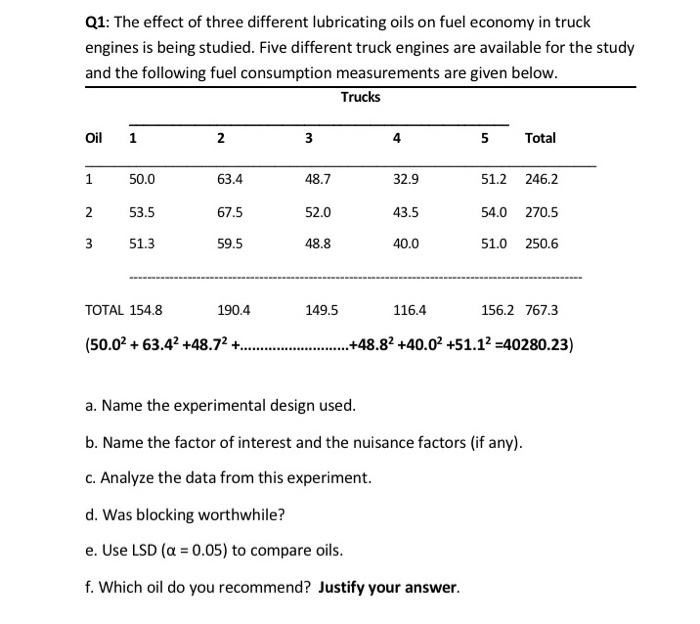
Q1: The effect of three different lubricating oils on fuel economy in truck engines is being studied. Five different truck engines are available for the study and the following fuel consumption measurements are given below. Trucks Oil 1 2 3 4 5 Total 1 50.0 63.4 48.7 32.9 51.2 246.2 2 53.5 67.5 52.0 43.5 54.0 270.5 3 51.3 59.5 48.8 40.0 51.0 250.6 ТOTAL 154.8 190.4 149.5 116.4 156.2 767.3 (50.02 + 63.4? +48.7? +.. .+48.82 +40.0² +51.1² =40280.23) a. Name the experimental design used. b. Name the factor of interest and the nuisance factors (if any). c. Analyze the data from this experiment. d. Was blocking worthwhile? e. Use LSD (a = 0.05) to compare oils. f. Which oil do you recommend? Justify your answer.
Q: Four laboratories were being used to perform chemical analyses. Samples of the same material were…
A: The hypothesis to be tested is H0: All the laboratories are equally effectiveH1: At least one of the…
Q: 2. Approximate the value of ſS (x² + y² +2) dA where R= [0,1] × [0, 1] using m = n = 2 and R sample…
A: To approximate ∬Rx2+y2+2dA where R=0,1×0,1 with m=n=2 and the sample points that give an…
Q: 1. Ali required to use inductive coupled plasma mass spectroscopy (ICP-MS) to analyze the amount of…
A: a) Here we have two independent and different samples. Therefore ,we will use T-test for Independent…
Q: ) What type of t-test should be used to compare the two methods and why? b) Do the two methods give…
A: Given Sample Method A Method B 1 0.39 0.36 2 0.84 1.35 3 1.76 2.56 4 3.35 3.92 5 4.69…
Q: The EPA tests cars for city miles per gallon (mpg). For one model, a sample of 16 cars were tested…
A: Given, Sample size = 16 Population mean = 27 The objective is to find the test statistic.
Q: The fuel efficiency, in miles per gallon, of 10 small utility trucks was measured. The results are…
A: Given that The fuel efficiency in miles per gallon Sample size (n) = 12 The data as follows 23, 25…
Q: To compare the effect of weather on sales of soft drinks, a soda manufacturer sampled two regions of…
A: In the given situation, the mean sales of soft drinks are compared. Here, the population standard…
Q: In an experiment to determine the effect of ambient temperature on the emissions of oxides of…
A: The test is carried out using Excel software and the procedure is given below, Enter the data into…
Q: A research poll showed that 1241 out of 1979 randomly polled people in a country favor the death…
A: Technology output of the proportion test:
Q: The data below are from an independent-measures experiment comparing three different treatment…
A:
Q: B G H. K L. M 1 2. A marketing research company tests the effectiveness of three new flavorings for…
A:
Q: 1. Ali required to use inductive coupled plasma mass spectroscopy (ICP-MS) to analyze amount of…
A: Method A : mean = 5.565 S.d = 4.2350 n = 8 Method B : mean = 5.004 S.d = 4.2032 n = 8
Q: Gasoline Mileage Without booster, X Gasoline Mileage Without booster, X, (mpg) (mpg) 21.2 23.8 25.4…
A: The null and alternative hypothesis is, H0:μ1-μ2=0 i.e. D=0Ha:μ1-μ2<0 i.e D<0 We have, n=7…
Q: The data below are from an independent-measures experiment comparing three different treatment…
A: Given Information: Total no. of treatments=03No. of observations (n)=12
Q: Consider the following scatter diagram: 25 20 15 10 Initial Which of the following best describes…
A: A scatter plot is given between initial and final temperatures.
Q: 8 F. b| 13 ョ|^,黑, I Normal T Aa A AaBbCcI AaBbCcI AABBCCD AaB AaBbCcI I No Spac... Heading 2…
A: As given in the test, we need to find if, the elderly people who own pets are equally likely to…
Q: he given quantities below were calculated from a sample data set. Σ 1-230 Συ- 198 Ey = 2664 Σ II 2 =…
A: Given data,
Q: The following data were obtained in a study of the relationship between the weight and chest size of…
A:
Q: Based on the Minitab output below from a Gauge R&R, what is the ATAG signal to noise ratio? Gage…
A: For the given data AIAG SIGNAL TO NOISE RATIO = 85.67%
Q: The following data refers to yield of tomatoes (kg/plot) for four different levels of salinity.…
A: Solution
Q: Two different analytical methods were used to determine residual chlorine in sewage effluents. Both…
A: INTROUDUCTION : PAIRED T TEST FOR DIFFERENCE OF MEANS : when the sample sizes are equal of both…
Q: A clinical psychologist is investigating the relationship between sleep and feelings of anxiety. For…
A: Given:Mx=6, SSx=16My=8, SSy=64 and SP=-20 Let x denotes the Hours of sleep and y denotes the Anxiety…
Q: FromSa$sampleSof n = 15 readingsSon X = Traffic$Volume$(carsSperShour$) Sand Y = Carbon Monoxide…
A:
Q: Two samples, one each from two batches of a product, were analyzed for trace iron content by the…
A: Given, α = 0.05 Two batches of product having specific iron content as given in table Batch A…
Q: The data below are from an independent-measures experiment comparing three different treatment…
A: The following information has been given: Treatment 1 Treatment 2 Treatment 3 0 1 4 0 4 3 0…
Q: Number of plants Treatment Regressed Thrived Total 80 120 200 B 140 60 200 The table above shows the…
A: How to read the table From the table we can see that total number of plants that recieved treatment…
Q: 4.28 Suppose that samples of polythene bags from two manufacturers A and B are tested by a buyer for…
A:
Q: 1. The average normal daily temperature ( in degree Celsius) and the corresponding average monthly…
A: Here data is given : We have to calculate r value and regression equation, slope of regression line,…
Q: Q1 A) List down the measures of central tendency and measures of dispersion 2) The operations…
A: Mean is the average of all the observations. It is defined using the formula x¯=∑xn Variance is the…
Q: For the model Y = Bo + B1X1 + B2X2 + B3X3 + B4X4 + ɛ. When testing Ho: B3 = 0 vs. Hai B3 # 0 at a =…
A: There are 4 independent variables. The dependent variable is Y. We have to test for significance of…
Q: The following data were obtained from a two-factor independent-measures experiment with n=10…
A: We have, a = number of levels of Factor A = 2 b = number of levels of Factor B = 2 n = 10 N = 40 ∝ =…
Q: Student X and Y decided to develop their skill in using the analytical balance. They tried measuring…
A:
Q: Q3 // In a detailed study of the productivity of a laboratory, the age distribution of its workers…
A: Interval f Midpoint, x fx (x-x) (x-x)2 f.(x-x)2 (x-x)4 f.(x-x)4 10-19 20 14.5 290 -16.1074…
Q: Two fuel additives are tested to determine their effect on miles per gallon for passenger cars. Test…
A: First compute the difference between the data of the additives. Following table gives the difference…
Q: 5. A study was conducted to determine the level of cyanide in 20 exposed spot (s the mine site are…
A: For Water : sample size (n1) = 20sample mean (x̄1) = Σx1 /n1 =…
Q: The following data refers to yield of tomatoes (kg/plot) for four different levels of salinity.…
A:
Q: 4.13 The effect of three different lubricating oils on fuel economy in diesel truck engines is being…
A:
Q: Is there any significant difference in the impact of procrastination in academic performance of the…
A: Given:
Q: The table shows data from a science fair experiment that studied the number of eggs that hatched a…
A:
Q: Assume a univariate quantitative data set, which contains fifty observations, has been organized by…
A: From the given information, cf1=9rf2=0.04f3=1 There are 50 observations. By adding 20 more…
Q: 5:(15 pts ). A random sample of 20 specimens of cobrdlar steel ylelded a Sompleaverage yield strenp…
A: n1 = 20 n2 = 25 x1 = 205 x2 = 239 s1 = 27 s2 = 35
Q: 3. Two analysts were given a standard reference material (SRM) and were asked to determine its…
A: Introduction - RSD (Relative standard deviation ) RSD=RSD=S×100xwhere ,S= standard deviation…
Q: An experiment was performed with seven hop plants. One half of each was pollinated and the other was…
A: Experiment was performed with seven hop plants : n1 =n2 = 7 Here , both sample are of small size ,…
Q: 1. A researcher would like to compare the acidity level of five brands of yogurt that being sold in…
A: Note: As per guidelines we will solve the first question only, please repost other questions for…
Q: The purpose of this activity is to compare the proportion of orange colored candy pieces between…
A: Let p1 = proportion of orange-colored candy pieces in the pack of skittles Let p2 = proportion of…
Q: You conducted additional studies with these men and found the following: The RR for those who drank…
A:
Q: A group of 5 cancer patients were subjected to drug treatment. The observations before and after…
A:
Q: d below are the measured radiation absorption rates (in W/kg) corresponding to 11 cell phones. Use…
A: From the given information we find the 5 number summary.
Q: For illustration, consider the results from an experiment conducted to measure the effects of six…
A:
Trending now
This is a popular solution!
Step by step
Solved in 4 steps with 1 images
- The performance of two analysts in determining total mercury (mg / kg) in fish was evaluated using the absorption spectrometry method. The results on the concentrations of mercury found in fish, for each analyst, are presented in the table below: Analyst 1 Analyst 2 7 12 9 8 6 9 11 13 13 14 8 9 7 8 13 10 12 7 9 15 (a)Is the performance in determining total mercury for Analyst 1 more accurate than Analyst 2? Compare the accuracy in the results of the two analysts at a 95% confidence level. Explain. (b)Are the results obtained by the two analysts, in the concentrations of mercury found in the fish, statistically equivalent, with 95% confidence? ExplainQ1 A) List down the measures of central tendency and measures of dispersion 2) The operations manager of a plant that manufactures tires wants to compare the actual inner diameters of two grades of tires, each of B) which is expected to be 575 millimeters. A sample of five tires of each grade was selected, and the results representing the inner diameters of the tires, ranked from smallest to largest, are as follows. Grade X grade Y 568 570 575 578 584 573 574 575 577 578 requirement. a) for each of the tow grades of tries, compute the mwan, median, and standred deviation. b) which grade of tire providing better quality? explain. c) what would be the effect on your answer in (a) and (b) if the last value for grade Y were 588 insert 578 explain. C) The file contins the overall miles per gallon (MPG) OF 2010 family sedan: 24 21 22 23 24 34 34 34 20 20 22 22 44 32 20 20 22 20 39 20 Source:…You want to conduct a test to determine whether there are significant differences in the mean impurity levels for polymers produced with three different catalysts. Which statistical test is appropriate for this scenario? Select one: a. paired t test b. one-sample t test c. one-way ANOVA d. two-sample t test
- A study assessed the lung destructive index among smokers and non- smokers provided the following data Smokers : overline x 1 =14.5 n 1 =12 S P =2.50 Non- Smokers: overline x 2 =9.5 n 2 =10 a = .05 From the available data, can we conclude that smokers have greater lung damage than non-smokers?Compare the two separate scatterplots. In particular, how do the associtation compare between women with pets vs. women without pets? Does one group have more variation in systolic blood pressure than the other? If so, for which group? Does systolic blood pressure seem higher for common ages between the two groups? If so, for which group?Penicillin is produced by the Penicillin fungus, which is grown in a broth whose sugar content must be carefully controlled. Several samples of broth were taken on three successive days, and the amount of dissolved sugars, in milligrams per milliliter, was measured on each sample. The results were as follows. Day 1 : 4.9 5.4 5.3 4.9 5.2 5.1 5.4 4.9 5.1 5.1 4.9 5.4 Day 2 : 5.5 5.2 5.1 5.0 5.3 5.4 5.3 5.2 5.4 5.3 5.4 5.1 Day 3 : 5.8 5.0 5.4 5.5 5.5 5.5 4.8 5.5 5.2 4.9 5.5 5.0 Construct an ANOVA table. Round your answers to four decimal places as needed. One-way ANOVA: Sugar Concentration Source DF SS MS F P Days Error Total Is there enough evidence to conclude that the mean sugar concentration…
- To compare the effect of weather on sales of soft drinks, a soda manufacturer sampled two regions of the country with the following results. Is there a difference in sales between the 2 regions? Using the 1% level of significance, what is the critical value?_____________Region A______Region BSample Size____1000__________1500Sales__________400___________500 Group of answer choices A. ± 2.58 B. ± 2.33 C. ± 1.96 D. ± 1.64Q1A) List down the measures of central tendency and measures of dispersion 1) Q1B) The operations manager of a plant that manufactures tires wants to compare the actual inner diameters of two grades of tires, each of which is expected to be 575 millimeters. A sample of five tires of each grade was selected, and the results representing the inner diameters of the tires, ranked from smallest to largest, are as follows. Grade X grade Y 568 570 575 578 584 573 574 575 577 578 requirement. a) for each of the tow grades of tries, compute the mwan, median, and standred deviation. b) which grade of tire providing better quality? explain. c) what would be the effect on your answer in (a) and (b) if the last value for grade Y were 588 insert 578 explain. PLEAS ANSWER Q1&B. THANK YOU.A local bus company is planning a new route to serve four housing subdivisions. Random samples of households are taken from each subdivision, and sample members are asked to rate, on a scale of 1 (strongly opposed) to 5 (strongly in favor), their reaction to the proposed service. The results are summarized in the accompanying table. Subdivision 1 Subdivision 2 Subdivision 3 Subdivision 4Ni 240 190 350 280ni 40 40 40 40x̄i 2.5 3.6 3.9 2.8si 0.8 0.9 1.2 0.7a. Find a 90% confidence interval for the mean reaction of households in subdivision 1.b. Using an unbiased estimation procedure, estimate the mean reaction of all households to be served by the new route. c. Find 90% and 95% confidence intervals…
- The article “Effect of Varying Solids Concentration and Organic Loading on the Performance of Temperature Phased Anaerobic Digestion Process” (S. Vandenburgh and T. Ellis, Water Environment Research, 2002:142–148) discusses experiments to determine the effect of the solids concentration on the performance of treatment methods for wastewater sludge. In the first experiment, the concentration of solids (in g/L) was 43.94 ± 1.18. In the second experiment, which was independent of the first, the concentration was 48.66 ± 1.76. Estimate the difference in the concentration between the two experiments, and find the uncertainty in the estimate.Two analysts were given a standard reference material (SRM) and were asked to determine its copper concentration (in mg/kg) using the EPA standard method. Each analyst was given sufficient time so they could produce as many accurate results as possible. Their results (mg/kg) were as follows: Analyst A 45.2, 47.3, 51.2, 50.4, 52.2, 48.7 (Standard error s = 2.62) Analyst B 49.4, 50.3, 51.6, 52.1, 50.9 (Standard error s = 1.06) (a) For Analyst A, is 52.2 mg/kg a possible outlier? (b) Calculate the RSD for each student; which analyst is more precise? (c) If the known concentration of copper in SRM is 49.5 mg/kg, which analyst is more accurate (without considering the deletion of outliers if any)?An analyst wants to know whether there is any significant difference in themeasurement results produced by alternative method compared areference method in determination of the concentration of vitamin C invegetables. He analysed eight different test materials using the bothmethods and the results are shown below:ethod Validation2Test material (mg Vitamin C/100 g)Method A B C D E F G HReference 291 397 379 233 365 291 289 189Alternative 272 403 389 224 368 282 286 201Difference 19 -6 -10 9 -3 9 3 -12Test if the alternative method provides compatible measurement results atsignificant level of 0.05. Given that ?? = 2.365.(? = 0.296)