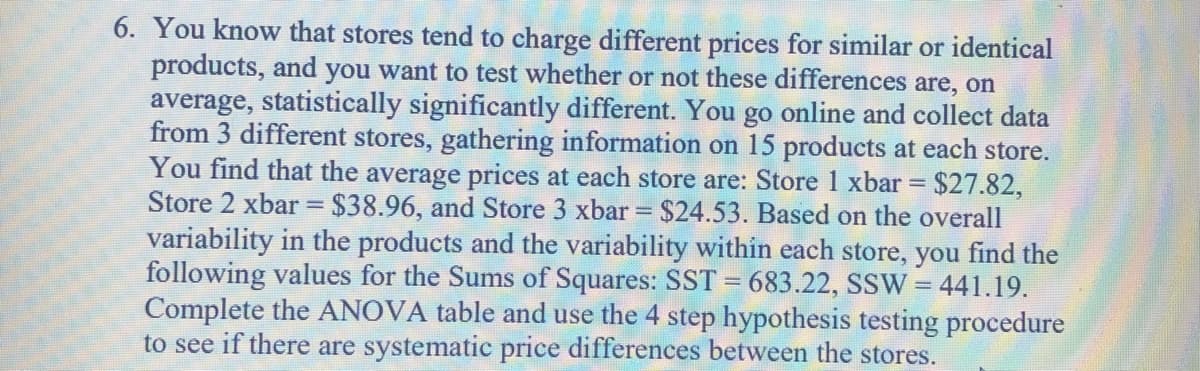
6. You know that stores tend to charge different prices for similar or identical products, and you want to test whether or not these differences are, on average, statistically significantly different. You go online and collect data from 3 different stores, gathering information on 15 products at each store. You find that the average prices at each store are: Store 1 xbar = $27.82, Store 2 xbar = $38.96, and Store 3 xbar = $24.53. Based on the overall variability in the products and the variability within each store, you find the following values for the Sums of Squares: SST = 683.22, SSW = 441.19. Complete the ANOVA table and use the 4 step hypothesis testing procedure to see if there are systematic price differences between the stores. %3D
6. You know that stores tend to charge different prices for similar or identical products, and you want to test whether or not these differences are, on average, statistically significantly different. You go online and collect data from 3 different stores, gathering information on 15 products at each store. You find that the average prices at each store are: Store 1 xbar = $27.82, Store 2 xbar = $38.96, and Store 3 xbar = $24.53. Based on the overall variability in the products and the variability within each store, you find the following values for the Sums of Squares: SST = 683.22, SSW = 441.19. Complete the ANOVA table and use the 4 step hypothesis testing procedure to see if there are systematic price differences between the stores. %3D

Glencoe Algebra 1, Student Edition, 9780079039897, 0079039898, 2018
18th Edition
ISBN:9780079039897
Author:Carter
Publisher:Carter
Chapter10: Statistics
Section10.4: Distributions Of Data
Problem 19PFA

Related questions
Question
Please show complete answers and steps on how to get to those answers.
Transcribed Image Text:6. You know that stores tend to charge different prices for similar or identical
products, and you want to test whether or not these differences are, on
average, statistically significantly different. You go online and collect data
from 3 different stores, gathering information on 15 products at each store.
You find that the average prices at each store are: Store 1 xbar = $27.82,
Store 2 xbar = $38.96, and Store 3 xbar = $24.53. Based on the overall
variability in the products and the variability within each store, you find the
following values for the Sums of Squares: SST = 683.22, SSW = 441.19.
Complete the ANOVA table and use the 4 step hypothesis testing procedure
to see if there are systematic price differences between the stores.
%3D
Expert Solution
Step 1
Null hypothesis: , there's no difference between the price of the stores.
Given SST = 683.22, SSW = 441.9
The ANOVA is given below:

Trending now
This is a popular solution!

Step by step
Solved in 3 steps

Knowledge Booster


Learn more about
Need a deep-dive on the concept behind this application? Look no further. Learn more about this topic, statistics and related others by exploring similar questions and additional content below.Recommended textbooks for you
Glencoe Algebra 1, Student Edition, 9780079039897…
Algebra
ISBN:
9780079039897
Author:
Carter
Publisher:
McGraw Hill
Glencoe Algebra 1, Student Edition, 9780079039897…
Algebra
ISBN:
9780079039897
Author:
Carter
Publisher:
McGraw Hill