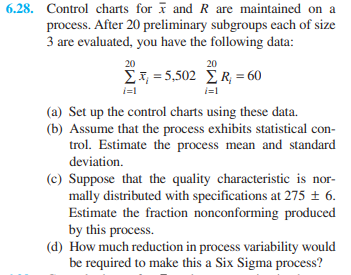
6.28. Control charts for I and R are maintained on a process. After 20 preliminary subgroups each of size 3 are evaluated, you have the following data: 20 20 Σ1502 ΣR =60 i=l i=1 (a) Set up the control charts using these data. (b) Assume that the process exhibits statistical con- trol. Estimate the process mean and standard deviation. (c) Suppose that the quality characteristic is nor- mally distributed with specifications at 275 ± 6. Estimate the fraction nonconforming produced by this process. (d) How much reduction in process variability would be required to make this a Six Sigma process?
6.28. Control charts for I and R are maintained on a process. After 20 preliminary subgroups each of size 3 are evaluated, you have the following data: 20 20 Σ1502 ΣR =60 i=l i=1 (a) Set up the control charts using these data. (b) Assume that the process exhibits statistical con- trol. Estimate the process mean and standard deviation. (c) Suppose that the quality characteristic is nor- mally distributed with specifications at 275 ± 6. Estimate the fraction nonconforming produced by this process. (d) How much reduction in process variability would be required to make this a Six Sigma process?

MATLAB: An Introduction with Applications
6th Edition
ISBN:9781119256830
Author:Amos Gilat
Publisher:Amos Gilat
Chapter1: Starting With Matlab
Section: Chapter Questions
Problem 1P

Related questions
Question
Transcribed Image Text:6.28. Control charts for I and R are maintained on a
process. After 20 preliminary subgroups each of size
3 are evaluated, you have the following data:
20
20
Σ1502 ΣR =60
i=l
i=1
(a) Set up the control charts using these data.
(b) Assume that the process exhibits statistical con-
trol. Estimate the process mean and standard
deviation.
(c) Suppose that the quality characteristic is nor-
mally distributed with specifications at 275 ± 6.
Estimate the fraction nonconforming produced
by this process.
(d) How much reduction in process variability would
be required to make this a Six Sigma process?
Expert Solution
This question has been solved!
Explore an expertly crafted, step-by-step solution for a thorough understanding of key concepts.

This is a popular solution!

Trending now
This is a popular solution!

Step by step
Solved in 3 steps with 3 images

Recommended textbooks for you
MATLAB: An Introduction with Applications
Statistics
ISBN:
9781119256830
Author:
Amos Gilat
Publisher:
John Wiley & Sons Inc

Probability and Statistics for Engineering and th…
Statistics
ISBN:
9781305251809
Author:
Jay L. Devore
Publisher:
Cengage Learning

Statistics for The Behavioral Sciences (MindTap C…
Statistics
ISBN:
9781305504912
Author:
Frederick J Gravetter, Larry B. Wallnau
Publisher:
Cengage Learning
MATLAB: An Introduction with Applications
Statistics
ISBN:
9781119256830
Author:
Amos Gilat
Publisher:
John Wiley & Sons Inc
Probability and Statistics for Engineering and th…
Statistics
ISBN:
9781305251809
Author:
Jay L. Devore
Publisher:
Cengage Learning
Statistics for The Behavioral Sciences (MindTap C…
Statistics
ISBN:
9781305504912
Author:
Frederick J Gravetter, Larry B. Wallnau
Publisher:
Cengage Learning

Elementary Statistics: Picturing the World (7th E…
Statistics
ISBN:
9780134683416
Author:
Ron Larson, Betsy Farber
Publisher:
PEARSON

The Basic Practice of Statistics
Statistics
ISBN:
9781319042578
Author:
David S. Moore, William I. Notz, Michael A. Fligner
Publisher:
W. H. Freeman

Introduction to the Practice of Statistics
Statistics
ISBN:
9781319013387
Author:
David S. Moore, George P. McCabe, Bruce A. Craig
Publisher:
W. H. Freeman