7) If in Figure 26.3.5 the economy does not return to full-employment equilibrium at point A, what will happen to the position of SAS and what type of inflation will result?
7) If in Figure 26.3.5 the economy does not return to full-employment equilibrium at point A, what will happen to the position of SAS and what type of inflation will result?

Chapter10: Aggregate Demand And Supply
Section10.A: The Self Correcting Aggregate Demand And Supply Model
Problem 1SQP

Related questions
Question
hi i did question 6) but i need help for question 7 and this question for
Transcribed Image Text:Price level (GDP deflator, 2002 = 100)
LAS
130
SAS
120
110
100
AD1
90
ADo
12.0
12.5
13.0
13.5
14.0
Real GDP (trillions of 2002 dollars)
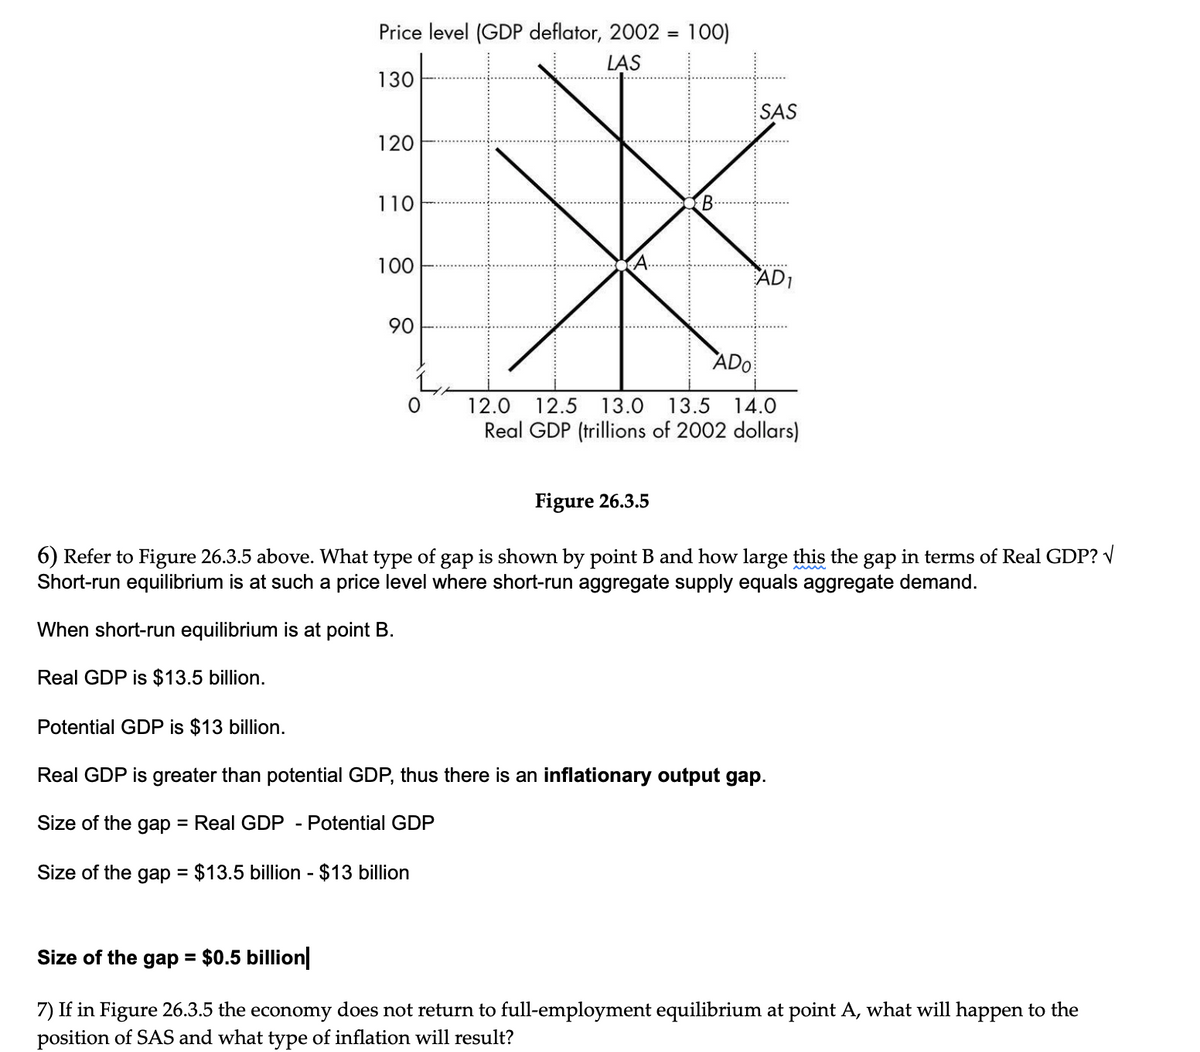
Figure 26.3.5
6) Refer to Figure 26.3.5 above. What type of gap is shown by point B and how large this the gap in terms of Real GDP? V
Short-run equilibrium is at such a price level where short-run aggregate supply equals aggregate demand.
When short-run equilibrium is at point B.
Real GDP is $13.5 billion.
Potential GDP is $13 billion.
Real GDP is greater than potential GDP, thus there is an inflationary output gap.
Size of the gap = Real GDP - Potential GDP
Size of the gap = $13.5 billion - $13 billion
Size of the gap = $0.5 billion|
%3D
7) If in Figure 26.3.5 the economy does not return to full-employment equilibrium at point A, what will happen to the
position of SAS and what type of inflation will result?
Expert Solution
This question has been solved!
Explore an expertly crafted, step-by-step solution for a thorough understanding of key concepts.

Step by step
Solved in 2 steps with 1 images

Knowledge Booster


Learn more about
Need a deep-dive on the concept behind this application? Look no further. Learn more about this topic, economics and related others by exploring similar questions and additional content below.Recommended textbooks for you


Economics (MindTap Course List)
Economics
ISBN:
9781337617383
Author:
Roger A. Arnold
Publisher:
Cengage Learning


Economics: Private and Public Choice (MindTap Cou…
Economics
ISBN:
9781305506725
Author:
James D. Gwartney, Richard L. Stroup, Russell S. Sobel, David A. Macpherson
Publisher:
Cengage Learning