
MATLAB: An Introduction with Applications
6th Edition
ISBN: 9781119256830
Author: Amos Gilat
Publisher: John Wiley & Sons Inc
expand_more
expand_more
format_list_bulleted
Related questions
Question
Need help with 8 d and e please

Transcribed Image Text:**Normal Distribution Problem Set**
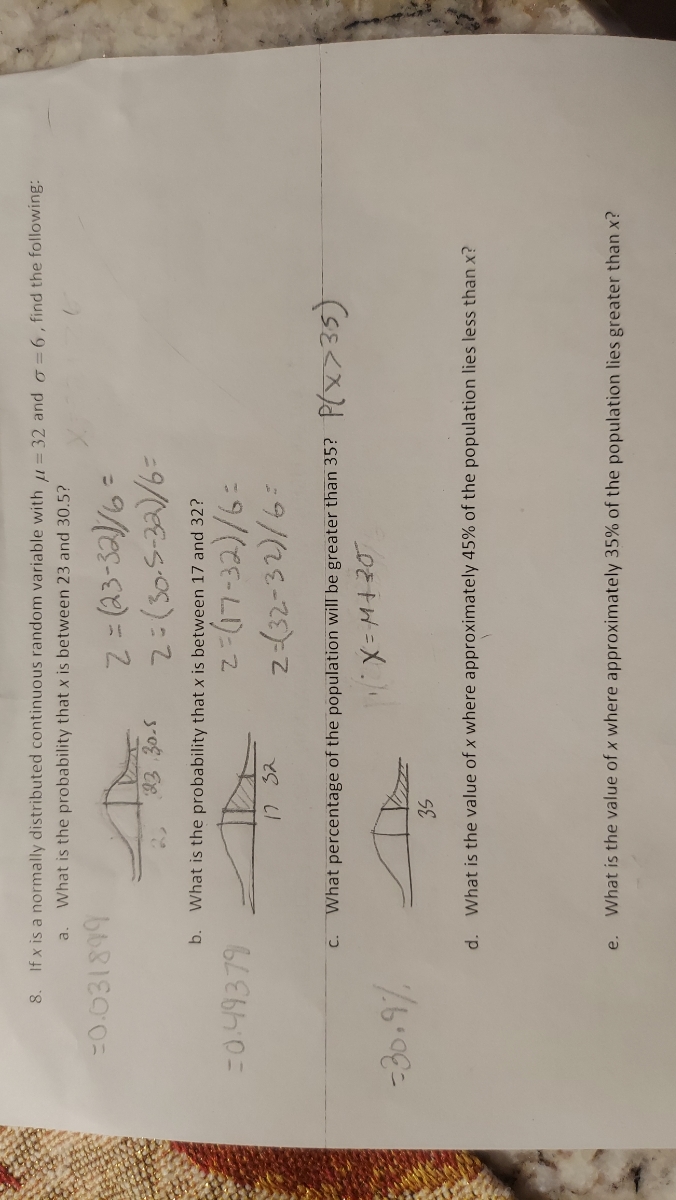
Consider \( x \) as a normally distributed continuous random variable with a mean (\( \mu \)) of 32 and a standard deviation (\( \sigma \)) of 6. Evaluate the following probabilities and questions:
a. **What is the probability that \( x \) is between 23 and 30.5?**
- Calculation: \( z = \frac{23-32}{6} \) and \( z = \frac{30.5-32}{6} \)
- **Result:** 0.0318
- **Graph Explanation:** This is represented by a shaded area on a normal distribution curve between 23 and 30.5.
b. **What is the probability that \( x \) is between 17 and 32?**
- Calculation: \( z = \frac{17-32}{6} \) and \( z = \frac{32-32}{6} \)
- **Result:** 0.49379
- **Graph Explanation:** The shaded area on the normal distribution curve represents this probability range, between 17 and 32.
c. **What percentage of the population will be greater than 35?**
- **Result:** 30.9%
- **Graph Explanation:** The shaded area above \( x = 35 \) shows this portion of the population in the normal distribution curve.
d. **What is the value of \( x \) where approximately 45% of the population lies less than \( x \)?**
- **Calculation:** \( x = \mu + z\sigma \) where \( z \) for 45th percentile is found
- **Graph Explanation:** The shaded area under the curve represents the 45th percentile mark.
e. **What is the value of \( x \) where approximately 35% of the population lies less than \( x \)?**
- **Graph Explanation:** This shows the point on the curve where the area to the left is 35%.
These exercises help to understand the properties of a normal distribution curve and the calculation of probabilities for given ranges.
Expert Solution
This question has been solved!
Explore an expertly crafted, step-by-step solution for a thorough understanding of key concepts.

This is a popular solution

Trending nowThis is a popular solution!

Step by stepSolved in 2 steps with 2 images

Knowledge Booster

Similar questions
arrow_back_ios
arrow_forward_ios
Recommended textbooks for you
- MATLAB: An Introduction with ApplicationsStatisticsISBN:9781119256830Author:Amos GilatPublisher:John Wiley & Sons Inc
 Probability and Statistics for Engineering and th...StatisticsISBN:9781305251809Author:Jay L. DevorePublisher:Cengage Learning
 Statistics for The Behavioral Sciences (MindTap C...StatisticsISBN:9781305504912Author:Frederick J Gravetter, Larry B. WallnauPublisher:Cengage Learning
  Elementary Statistics: Picturing the World (7th E...StatisticsISBN:9780134683416Author:Ron Larson, Betsy FarberPublisher:PEARSON
 The Basic Practice of StatisticsStatisticsISBN:9781319042578Author:David S. Moore, William I. Notz, Michael A. FlignerPublisher:W. H. Freeman
 Introduction to the Practice of StatisticsStatisticsISBN:9781319013387Author:David S. Moore, George P. McCabe, Bruce A. CraigPublisher:W. H. Freeman
MATLAB: An Introduction with Applications
Statistics
ISBN:9781119256830
Author:Amos Gilat
Publisher:John Wiley & Sons Inc
Probability and Statistics for Engineering and th...
Statistics
ISBN:9781305251809
Author:Jay L. Devore
Publisher:Cengage Learning
Statistics for The Behavioral Sciences (MindTap C...
Statistics
ISBN:9781305504912
Author:Frederick J Gravetter, Larry B. Wallnau
Publisher:Cengage Learning
Elementary Statistics: Picturing the World (7th E...
Statistics
ISBN:9780134683416
Author:Ron Larson, Betsy Farber
Publisher:PEARSON
The Basic Practice of Statistics
Statistics
ISBN:9781319042578
Author:David S. Moore, William I. Notz, Michael A. Fligner
Publisher:W. H. Freeman
Introduction to the Practice of Statistics
Statistics
ISBN:9781319013387
Author:David S. Moore, George P. McCabe, Bruce A. Craig
Publisher:W. H. Freeman