80 80 72.9 70.1 68.6 LL 70 68.0 70 60 60 C 50 50 Metric Tons 40- 375 Metric Tons 40 38.0 30 30 20.3 20 18.2 20 15.0 a 14.6 10 10 O Pollock Cod Flatfish Rockfish Sablefish O Pollock Cod Flatfish Rockfish Sablefish 80 80 72.1 72.7


Unitary Method
The word “unitary” comes from the word “unit”, which means a single and complete entity. In this method, we find the value of a unit product from the given number of products, and then we solve for the other number of products.
Speed, Time, and Distance
Imagine you and 3 of your friends are planning to go to the playground at 6 in the evening. Your house is one mile away from the playground and one of your friends named Jim must start at 5 pm to reach the playground by walk. The other two friends are 3 miles away.
Profit and Loss
The amount earned or lost on the sale of one or more items is referred to as the profit or loss on that item.
Units and Measurements
Measurements and comparisons are the foundation of science and engineering. We, therefore, need rules that tell us how things are measured and compared. For these measurements and comparisons, we perform certain experiments, and we will need the experiments to set up the devices.
It's not an easy life, but it's a good life! Suppose you decide to take the summer off and sign on as a deck hand for a commercial fishing boat in Alaska that specializes in deep-water fishing for groundfish. What kind of fish can you expect to catch? One way to answer this question is to examine government reports on groundfish caught in the Gulf of Alaska. The following list indicates the types of fish caught annually in thousands of metric tons: flatfish, 38.0; Pacific cod, 68.6; sablefish, 15.0; Walleye pollock, 70.1; rockfish, 20.3. Make a Pareto chart showing the annual harvest for commercial fishing in the Gulf of Alaska.
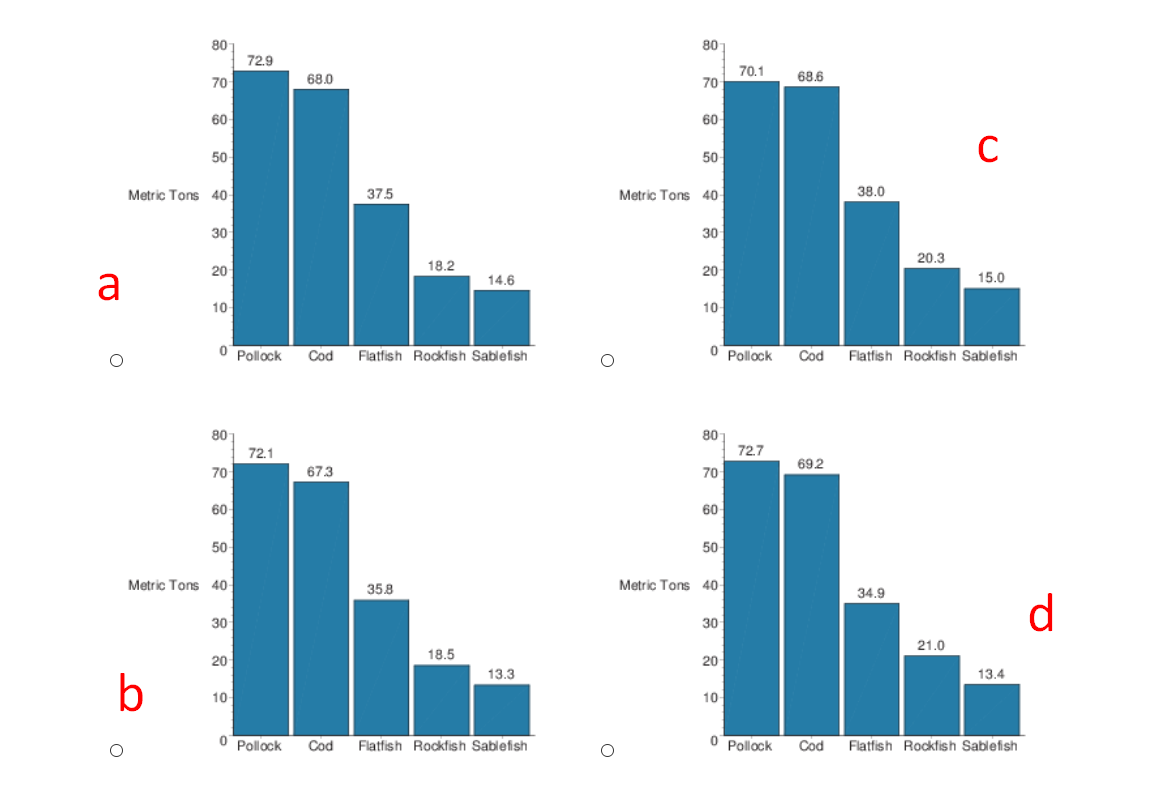
Pareto chart is a type of chart that indicates both bar graph and line graph. In the Pareto chart, the values are indicating in descending order by bars. It helps in identifying the defects and complaints.

Trending now
This is a popular solution!

Step by step
Solved in 2 steps


