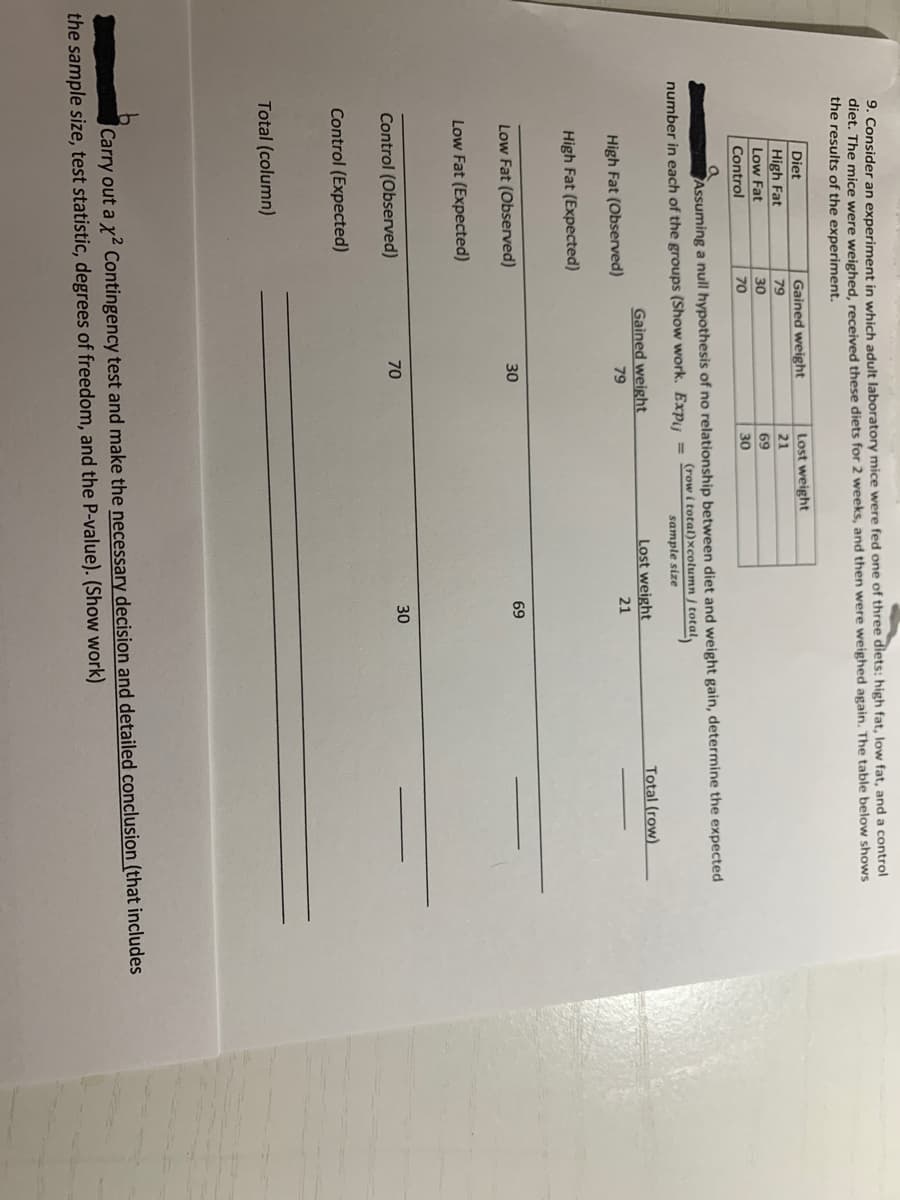
9. Consider an experiment in which adult laboratory mice were fed one of three diets: high fat, low fat, and a control diet. The mice were weighed, received these diets for 2 weeks, and then were weighed again. The table below shows the results of the experiment. Diet Gained weight Lost weight High Fat 79 21 Low Fat 30 69 Control 70 30 Assuming a null hypothesis of no relationship between diet and weight gain, determine the expected (row i total)xcolumn / total number in each of the groups (Show work. Expu = sample size Gained weight Lost weight Total (row). High Fat (Observed) 79 21 High Fat (Expected) Low Fat (Observed) 30 69 Low Fat (Expected) Control (Observed) 70 30 Control (Expected) Total (column) Carry out a x Contingency test and make the necessary decision and detailed conclusion (that includes the sample size, test statistic, degrees of freedom, and the P-value). (Show work)
9. Consider an experiment in which adult laboratory mice were fed one of three diets: high fat, low fat, and a control diet. The mice were weighed, received these diets for 2 weeks, and then were weighed again. The table below shows the results of the experiment. Diet Gained weight Lost weight High Fat 79 21 Low Fat 30 69 Control 70 30 Assuming a null hypothesis of no relationship between diet and weight gain, determine the expected (row i total)xcolumn / total number in each of the groups (Show work. Expu = sample size Gained weight Lost weight Total (row). High Fat (Observed) 79 21 High Fat (Expected) Low Fat (Observed) 30 69 Low Fat (Expected) Control (Observed) 70 30 Control (Expected) Total (column) Carry out a x Contingency test and make the necessary decision and detailed conclusion (that includes the sample size, test statistic, degrees of freedom, and the P-value). (Show work)

MATLAB: An Introduction with Applications
6th Edition
ISBN:9781119256830
Author:Amos Gilat
Publisher:Amos Gilat
Chapter1: Starting With Matlab
Section: Chapter Questions
Problem 1P

Related questions
Question
hw 9a&b help
Transcribed Image Text:9. Consider an experiment in which adult laboratory mice were fed one of three diets: high fat, low fat, and a control
diet. The mice were weighed, received these diets for 2 weeks, and then were weighed again. The table below shows
the results of the experiment.
Diet
Gained weight
Lost weight
High Fat
Low Fat
79
21
30
69
Control
70
30
Assuming a null hypothesis of no relationship between diet and weight gain, determine the expected
(row i total)xcolumn j total
number in each of the groups (Show work. Expu =
sample size
Gained weight
Lost weight
Total (row).
High Fat (Observed)
79
21
High Fat (Expected)
69
Low Fat (Observed)
30
Low Fat (Expected)
30
Control (Observed)
70
Control (Expected)
Total (column)
Carry out a x Contingency test and make the necessary decision and detailed conclusion (that includes
the sample size, test statistic, degrees of freedom, and the P-value). (Show work)
Expert Solution
This question has been solved!
Explore an expertly crafted, step-by-step solution for a thorough understanding of key concepts.

This is a popular solution!

Trending now
This is a popular solution!

Step by step
Solved in 3 steps with 5 images

Recommended textbooks for you
MATLAB: An Introduction with Applications
Statistics
ISBN:
9781119256830
Author:
Amos Gilat
Publisher:
John Wiley & Sons Inc

Probability and Statistics for Engineering and th…
Statistics
ISBN:
9781305251809
Author:
Jay L. Devore
Publisher:
Cengage Learning

Statistics for The Behavioral Sciences (MindTap C…
Statistics
ISBN:
9781305504912
Author:
Frederick J Gravetter, Larry B. Wallnau
Publisher:
Cengage Learning
MATLAB: An Introduction with Applications
Statistics
ISBN:
9781119256830
Author:
Amos Gilat
Publisher:
John Wiley & Sons Inc
Probability and Statistics for Engineering and th…
Statistics
ISBN:
9781305251809
Author:
Jay L. Devore
Publisher:
Cengage Learning
Statistics for The Behavioral Sciences (MindTap C…
Statistics
ISBN:
9781305504912
Author:
Frederick J Gravetter, Larry B. Wallnau
Publisher:
Cengage Learning

Elementary Statistics: Picturing the World (7th E…
Statistics
ISBN:
9780134683416
Author:
Ron Larson, Betsy Farber
Publisher:
PEARSON

The Basic Practice of Statistics
Statistics
ISBN:
9781319042578
Author:
David S. Moore, William I. Notz, Michael A. Fligner
Publisher:
W. H. Freeman

Introduction to the Practice of Statistics
Statistics
ISBN:
9781319013387
Author:
David S. Moore, George P. McCabe, Bruce A. Craig
Publisher:
W. H. Freeman