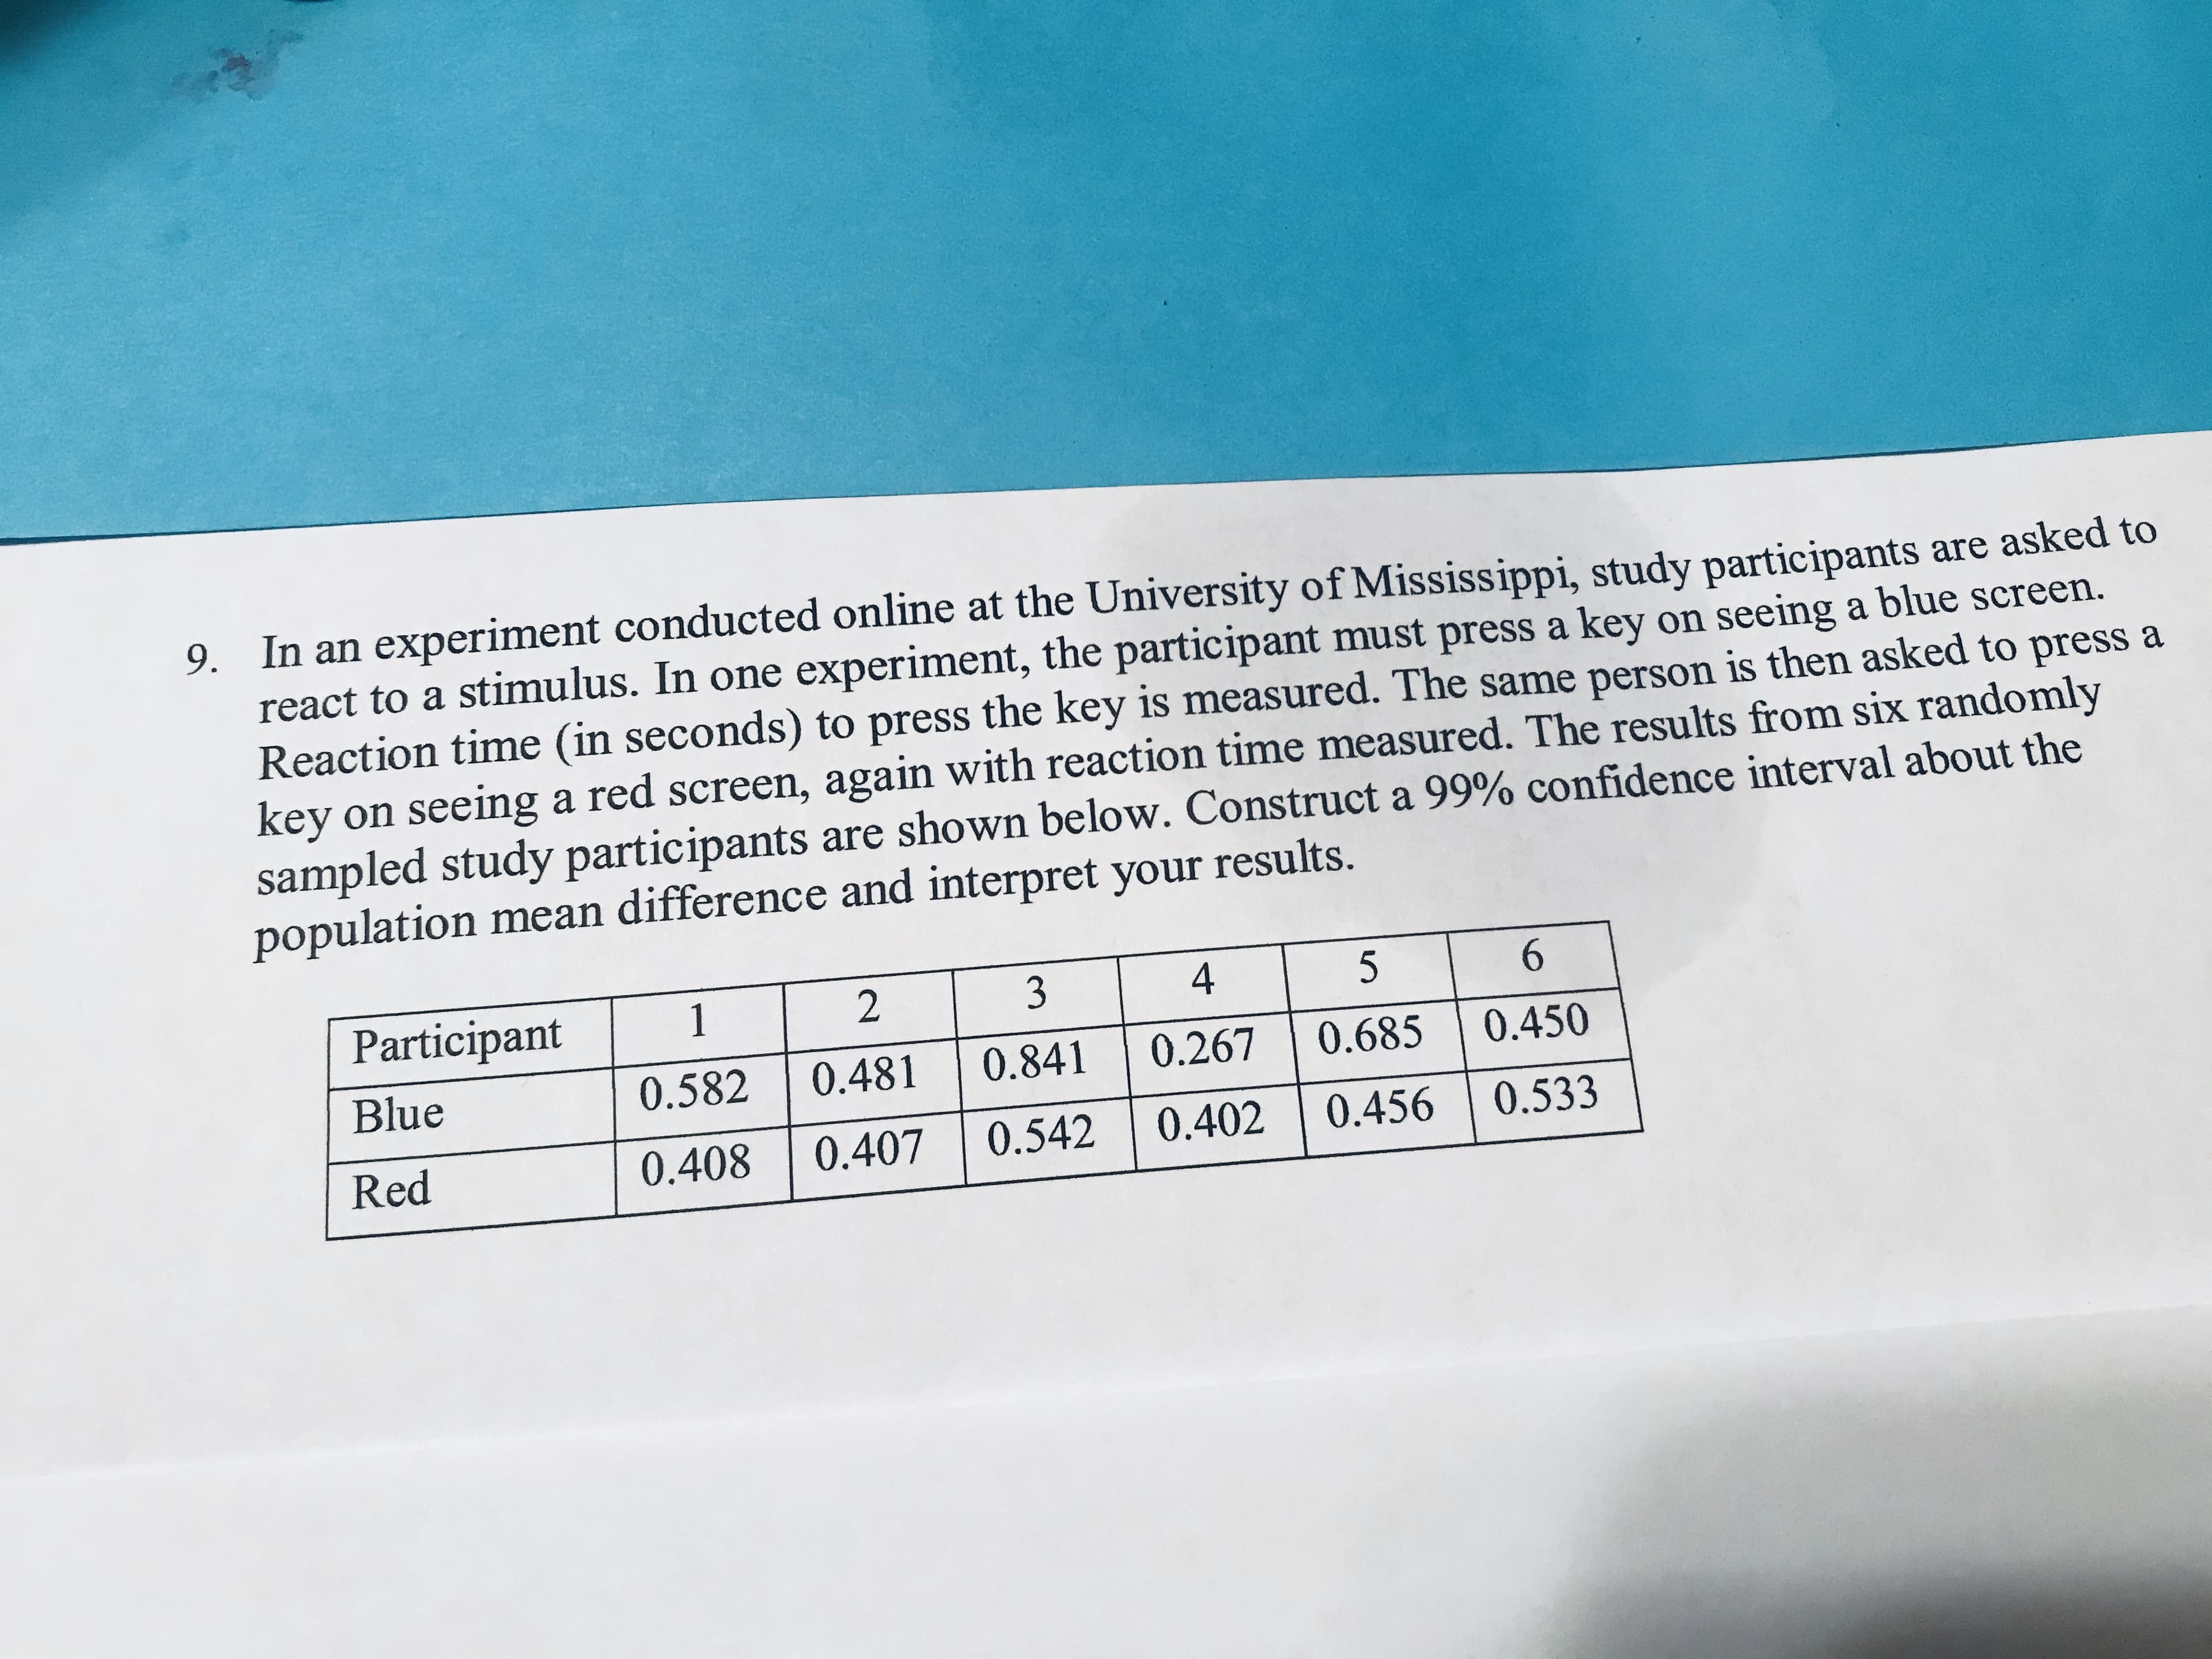
9. In an experiment conducted online at the University of Mississippi, study participants are asked to react to a stimulus. In one experiment, the participant must press a key on seeing a blue screen. Reaction time (in seconds) to press the key is measured. The same person is then asked to press a key on seeing a red screen, again with reaction time measured. The results from six randomly sampled study participants are shown below. Construct a 99% confidence interval about the population mean difference and interpret your results. Participant 3 6. Blue 0.582 0.481 0.841 0.267 0.685 0.450 Red 0.408 0.407 0.542 0.402 0.456 0.533
9. In an experiment conducted online at the University of Mississippi, study participants are asked to react to a stimulus. In one experiment, the participant must press a key on seeing a blue screen. Reaction time (in seconds) to press the key is measured. The same person is then asked to press a key on seeing a red screen, again with reaction time measured. The results from six randomly sampled study participants are shown below. Construct a 99% confidence interval about the population mean difference and interpret your results. Participant 3 6. Blue 0.582 0.481 0.841 0.267 0.685 0.450 Red 0.408 0.407 0.542 0.402 0.456 0.533

College Algebra (MindTap Course List)
12th Edition
ISBN:9781305652231
Author:R. David Gustafson, Jeff Hughes
Publisher:R. David Gustafson, Jeff Hughes
Chapter8: Sequences, Series, And Probability
Section8.7: Probability
Problem 58E: What is meant by the sample space of an experiment?

Related questions
Question
Transcribed Image Text:9. In an experiment conducted online at the University of Mississippi, study participants are asked to
react to a stimulus. In one experiment, the participant must press a key on seeing a blue screen.
Reaction time (in seconds) to press the key is measured. The same person is then asked to press a
key on seeing a red screen, again with reaction time measured. The results from six randomly
sampled study participants are shown below. Construct a 99% confidence interval about the
population mean difference and interpret your results.
Participant
3
6.
Blue
0.582
0.481
0.841
0.267
0.685
0.450
Red
0.408
0.407
0.542
0.402
0.456
0.533
Expert Solution
This question has been solved!
Explore an expertly crafted, step-by-step solution for a thorough understanding of key concepts.

This is a popular solution!

Trending now
This is a popular solution!

Step by step
Solved in 2 steps with 4 images

Recommended textbooks for you
College Algebra (MindTap Course List)
Algebra
ISBN:
9781305652231
Author:
R. David Gustafson, Jeff Hughes
Publisher:
Cengage Learning
College Algebra (MindTap Course List)
Algebra
ISBN:
9781305652231
Author:
R. David Gustafson, Jeff Hughes
Publisher:
Cengage Learning