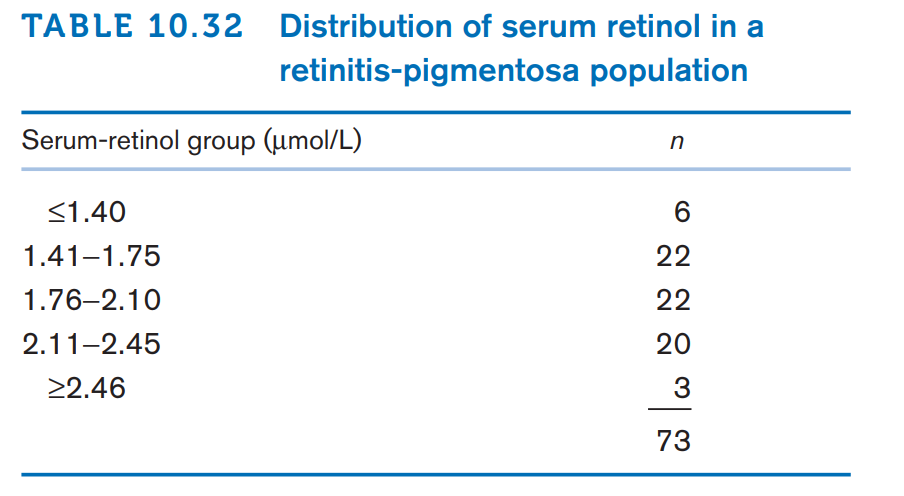
A 5-year study among 601 participants with retinitis pigmentosa assessed the effects of high-dose vitamin A (15,000 IU per day) and vitamin E (400 IU per day) on the course of their disease. One issue is to what extent supplementation with vitamin A affected their serum-retinol levels. The serum-retinol data in Table 10.31 were obtained over 3 years of follow-up among 73 males taking 15,000 IU/day of vitamin A (vitamin A group) and among 57 males taking 75 IU/day of vitamin A (the trace group; this is a negligible amount compared with usual dietary intake of 3000 IU/day) 10.68 What test can be used to assess whether mean serum retinol has increased over 3 years among subjects in the vitamin A group? 10.70 One assumption of the test in Problem 10.68 is that the distribution of serum retinol is approximately normal. To verify this assumption, the investigators obtained a frequency distribution of serum retinol at year 0 among males in the vitamin A group, with data as shown in Table 10.32. Perform a statistical test to check on the normality assumption. Given your results, do you feel the assumption of normality is warranted? Why or why not?


A 5-year study among 601 participants with retinitis pigmentosa assessed the effects of high-dose vitamin A (15,000 IU per day) and vitamin E (400 IU per day) on the course of their disease. One issue is to what extent supplementation with vitamin A affected their serum-retinol levels. The serum-retinol data in Table 10.31 were obtained over 3 years of follow-up among 73 males taking 15,000 IU/day of vitamin A (vitamin A group) and among 57 males taking 75 IU/day of vitamin A (the trace group; this is a negligible amount compared with usual dietary intake of 3000 IU/day)
10.68 What test can be used to assess whether mean
serum retinol has increased over 3 years among subjects in
the vitamin A group?
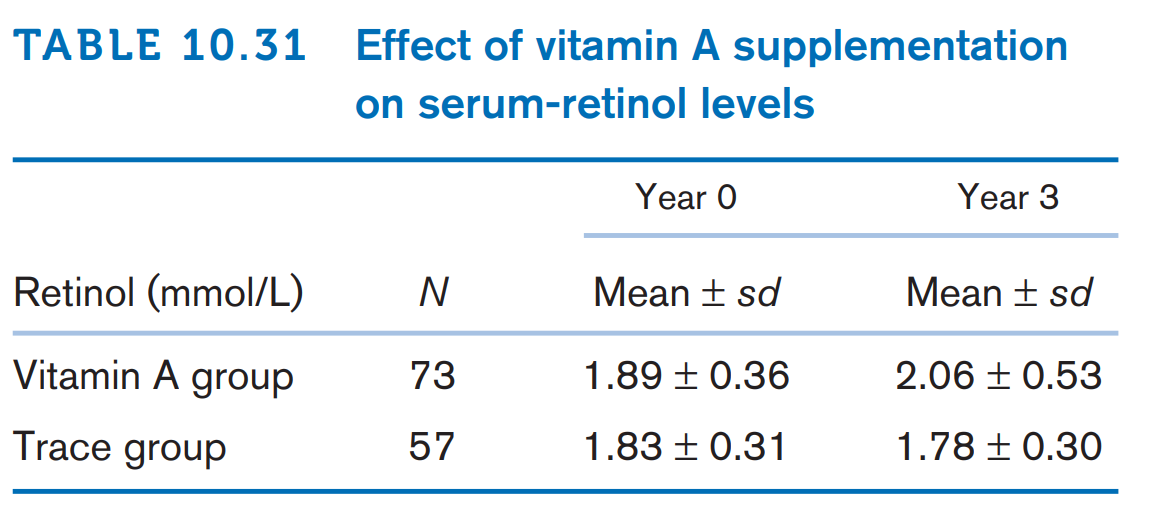
10.70 One assumption of the test in Problem 10.68 is that
the distribution of serum retinol is approximately normal.
To verify this assumption, the investigators obtained a frequency distribution of serum retinol at year 0 among males
in the vitamin A group, with data as shown in Table 10.32.
Perform a statistical test to check on the normality assumption. Given your results, do you feel the assumption of normality is warranted? Why or why not?


Trending now
This is a popular solution!

Step by step
Solved in 4 steps with 4 images


