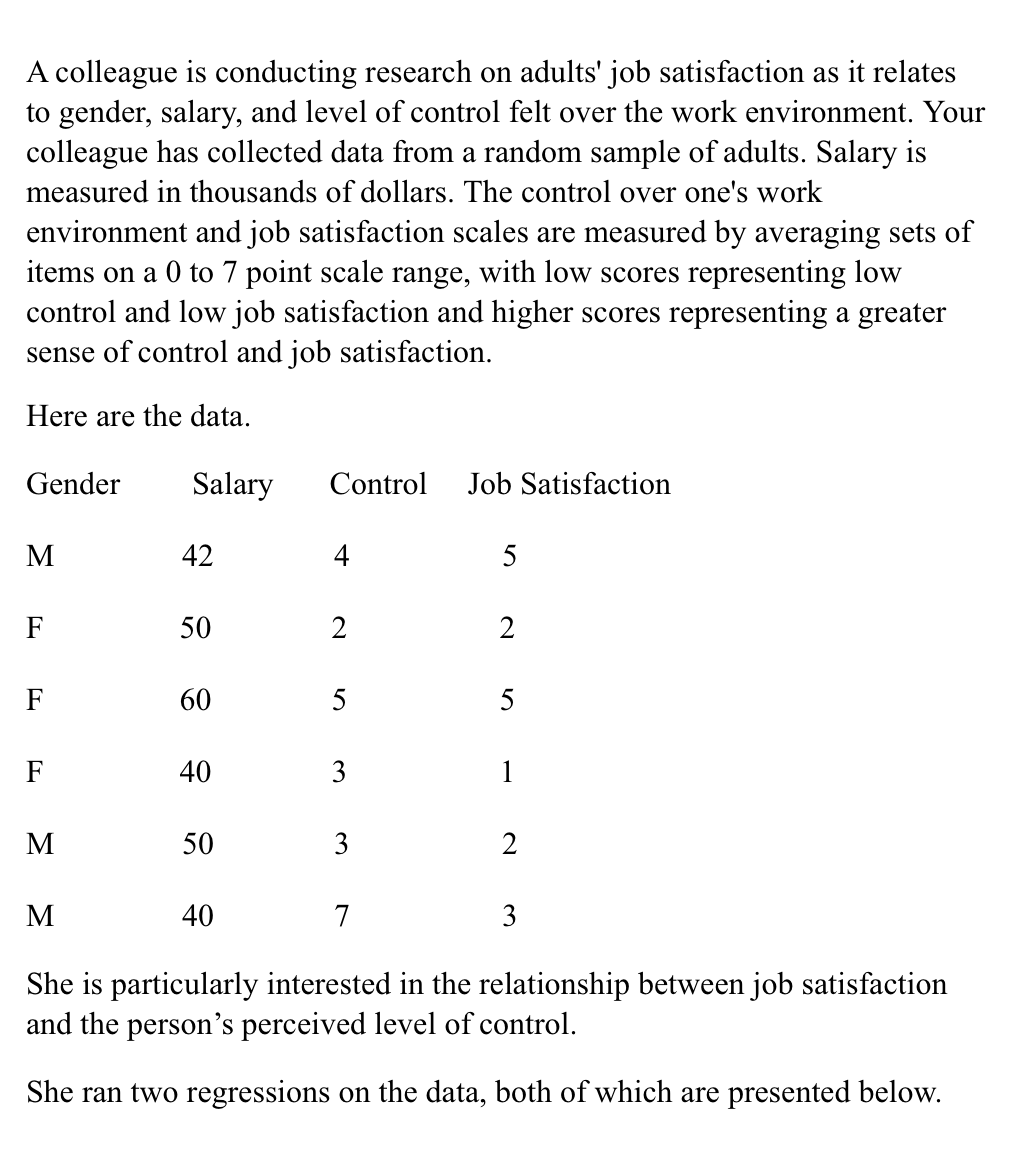
A colleague is conducting research on adults' job satisfaction as it relates to gender, salary, and level of control felt over the work environment. Your colleague has collected data from a random sample of adults. Salary is measured in thousands of dollars. The control over one's work environment and job satisfaction scales are measured by averaging sets of items on a 0 to 7 point scale range, with low scores representing low control and low job satisfaction and higher scores representing a greater sense of control and job satisfaction.
A colleague is conducting research on adults' job satisfaction as it relates to gender, salary, and level of control felt over the work environment. Your colleague has collected data from a random sample of adults. Salary is measured in thousands of dollars. The control over one's work environment and job satisfaction scales are measured by averaging sets of items on a 0 to 7 point scale range, with low scores representing low control and low job satisfaction and higher scores representing a greater sense of control and job satisfaction.

Algebra & Trigonometry with Analytic Geometry
13th Edition
ISBN:9781133382119
Author:Swokowski
Publisher:Swokowski
Chapter2: Equations And Inequalities
Section2.1: Equations
Problem 58E

Related questions
Question
Transcribed Image Text:A colleague is conducting research on adults' job satisfaction as it relates
to gender, salary, and level of control felt over the work environment. Your
colleague has collected data from a random sample of adults. Salary is
measured in thousands of dollars. The control over one's work
environment and job satisfaction scales are measured by averaging sets of
items on a 0 to 7 point scale range, with low scores representing low
control and low job satisfaction and higher scores representing a greater
sense of control and job satisfaction.
Here are the data.
Gender
Salary
Control
Job Satisfaction
M
42
4
F
50
2
F
60
5
5
F
40
3
1
M
50
3
2
M
40
7
3
She is particularly interested in the relationship between job satisfaction
and the person's perceived level of control.
She ran two regressions on the data, both of which are presented below.
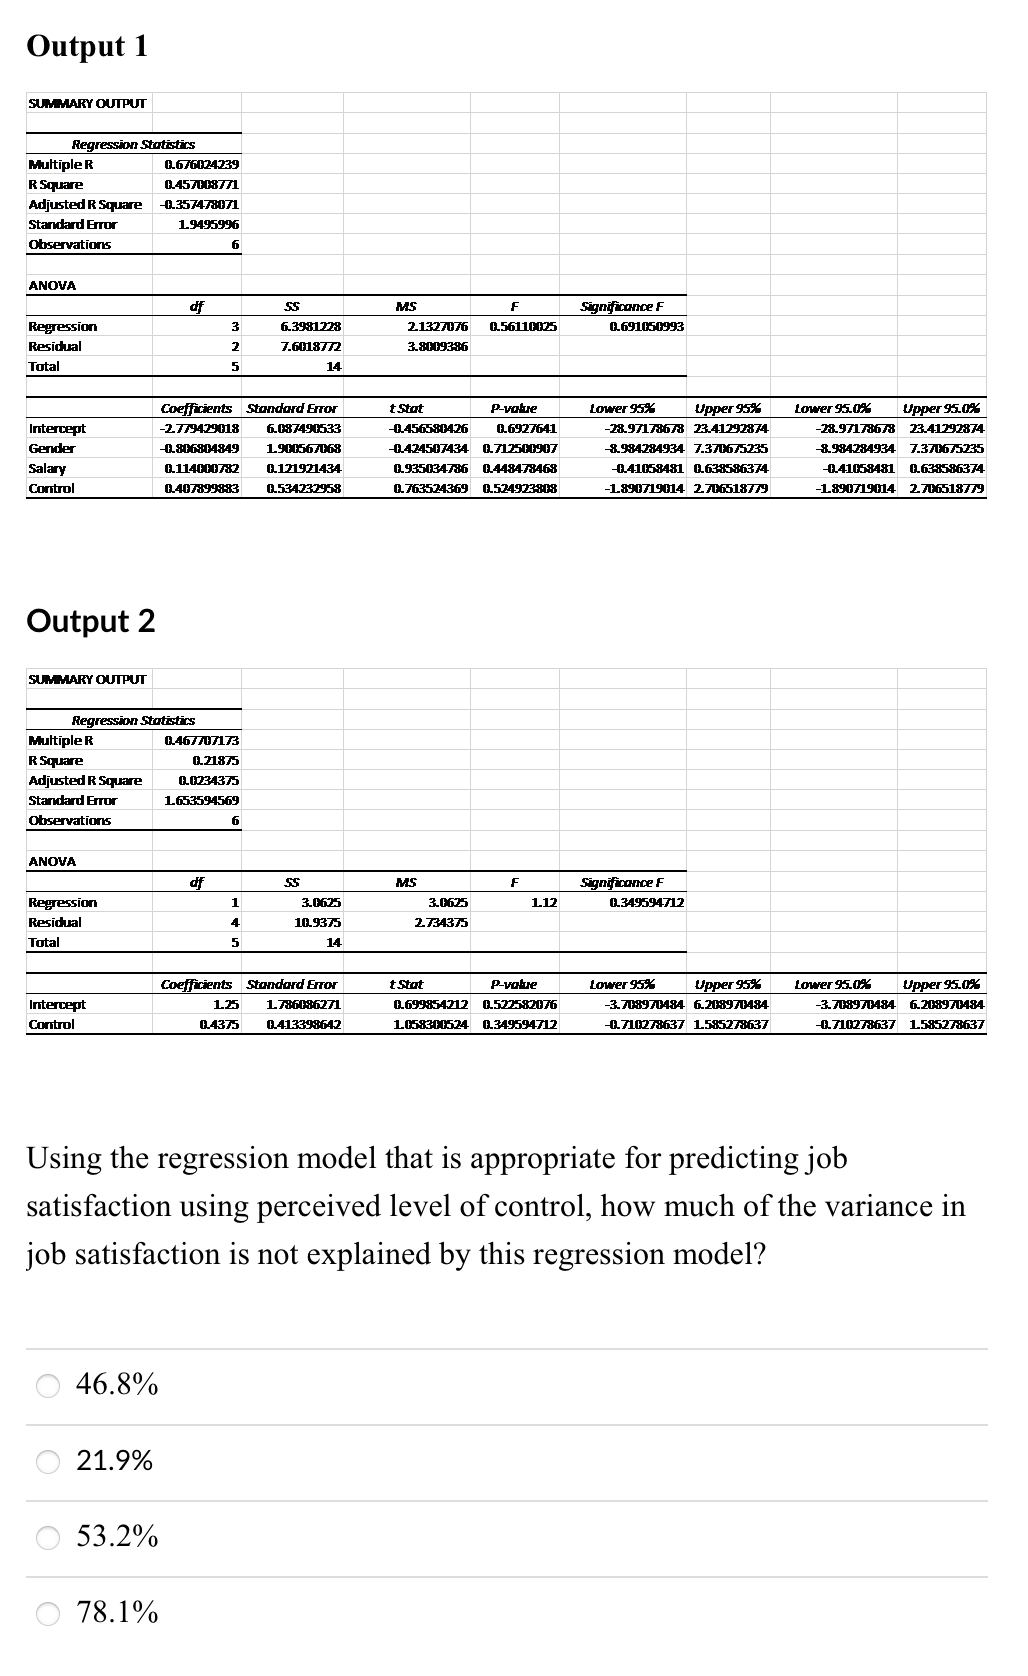
Transcribed Image Text:Output 1
SUMMARY OUTPUT
Regression Stoatistics
Multiple R
0.676024239
R Square
0.457008771
Adjusted R Square
-0.357478071
Standard Eror
19495996
Observations
6
ANOVA
Significonce F
0.691050993
df
SS
MS
Regression
3
6.3981228
2,1327076
0.56110025
Residual
2
7.6018772
3.8009386
Total
14
Coefficients Stondard Eror
tStat
P-votue
Lower 95%
Upper 95%
Lower 95.0%
Upper 95.0%
Intercept
-2779429018
6.087490533
0.456580426
0.6927641
-28.97178678 23.41292874
-28.97178678 23.41292874
Gender
-0.806804849
1.900567068
-0.424507434 0.71250097
-8.984284934 7.370675235
-8.984284934 7.370675235
Salary
0.114000782
0.121921434
0.935034786 0.448478468
-0.41058481 0.638586374
0.41058481 0.638586374
Control
0.407899883
0.53423295
0.763524369 0.524923808
-1.890719014 270651879
-1.890719014
2706518779
Output 2
SUMMARY OUTPUT
Regression Statistics
Multiple R
0,467707173
RSquare
0.21875
Adjusted R Square
0.0234375
Standard Error
1653594569
Observations
6
ANOVA
df
Significonce F
SS
MS
F
Regression
Residual
1.
3.0625
3.0625
112
0.349594712
4
10.9375
2734375
Total
14
Coefficients Stondard Error
1.786086271
tStat
P-vatue
Lower 95%
Upper 95%
Lower 95.0%
Upper 95.0%
Intercept
1.25
0.699954212 0.522582076
-3.708970484 6.208970484
-3.708970484 6.208970484
Control
0.4375
0.413398642
1058300524
0.349594712
-0.710278637 1.585278637
-0.710278637
1.585278637
Using the regression model that is appropriate for predicting job
satisfaction using perceived level of control, how much of the variance in
job satisfaction is not explained by this regression model?
46.8%
21.9%
53.2%
78.1%
Expert Solution
Step 1
Given:
The output given are shown below

Trending now
This is a popular solution!

Step by step
Solved in 2 steps with 1 images

Recommended textbooks for you
Algebra & Trigonometry with Analytic Geometry
Algebra
ISBN:
9781133382119
Author:
Swokowski
Publisher:
Cengage
Algebra & Trigonometry with Analytic Geometry
Algebra
ISBN:
9781133382119
Author:
Swokowski
Publisher:
Cengage