Milka makes boxes of chocolates for which the demand is uncertain. " Quarterly demand (in boxes of chocolates) for the last 3 years follows: Quarter Year 1 Year 2 Year 3 1 3,000 3,300 3,502 2 1,700 2,100 2,448 3 900 1,500 1,768 4 4,400 5,100 5,882 Total 10,000 12,000 13,600 a- Use intuition and judgment to estimate quarterly demand for the fourth year. b- Use weighted moving average to estimate the demand for every quarter in the fourth year. Try to calculate the weights from historical data of last two years
Q: The expenditure pattern of certain households in the Greater Accra region of Ghana is presented in…
A: We have the computations as below: Annual Expenditure Class mark (xi) Households (fi)…
Q: The table below shows monthly data collected on production costs and on the number of units produced…
A: Step 1: We perform regression using the step by step procedure in excel as below: Enter the data…
Q: Demand for portable music players for joggers has caused Nancy Industries (Nancy) to grow almost 50…
A: Let the linear regression equation is given by Y = A + Bt where t is time in months,…
Q: Milka makes boxes of chocolates for which the demand is uncertain. " Quarterly demand (in boxes of…
A: Given information: Quarter Year 1 Year 2 Year 3 Year 4 1 3000 3300 3502 3700 2 1700 2100…
Q: . A farmer has recently acquired a 50 hectares piece of land. He has decided to grow corn and banana…
A: To formulate a linear programming problem for the given situation.
Q: product will create a demand for it among department store buyers. The following table shows the…
A: Comment: As per the our company guidelines we are supposed to answer only three subparts. Kindly…
Q: 7. Lawson's Department Store faces a buying decision for a seasonal product for which demand can be…
A: The prior probabilies for the states of nature are :P(51) = 0.3P(-2) = 0.3P(53) = 0.4
Q: Populate the table American Net Barrel Oil ($) Year Income ($ ху y (x) million) (y) 2005 56 -850…
A: ( Please note that ∑x2=28015 ) The data for American's net income and price of oil is listed…
Q: Data collected from the economy of Cardtown reveals that a 16% increase in income leads to the…
A:
Q: Table: Data of House Value versus Rental Value Rental Value Rental Value Rental Value…
A: Given data, Value Rental 81000 6656 95000 7904 121000 12064 135000 8320 145000 8320…
Q: Her operations manager is considering a new plan, which begins in January with 200 units of…
A:
Q: a) Agnes, a General Manager in XXX Company, estimated a multiplicative demand function of the form:…
A: Estimated demand equation is given by, Qd= aPapIaiP0a0 Then Qd= 0.022*P(-223)I1.354P00.133
Q: A company that produces bottled pomegranate juice. A planner has developed an aggregate forecast for…
A: We have to prepare aggregate plan:
Q: 2. What features Bad Presentation Good Presentation of the 'Good Minimum Wage Minimum Wage 1.00…
A: Given: Two Bad and Good Presentation
Q: The demand for a product of a company in each of the last twelve months is shown in the table below;…
A: Given data: The given demand for September is DS=56. The given demand for October is DO=52. The…
Q: Two different forecasting techniques (F1 and F2) were used to forecast demand for cases of bottled…
A: We will proceed into this way
Q: Considering the aggregated demand for coffee beans for the following months shown below, what would…
A: Data is given for 6 months, We have to calculate forcast for 8 th month. We will use 3 months moving…
Q: Find the market equilibrium point for the following demand and supply functions. Demand: p =…
A: Consider the given information. Demand: p=-4q+288Supply: p=6q+4 To find the equilibrium point…
Q: Coca-Cola Revenues ($ millions), 2005-2010 Quarter Qtrl Qtr2 Qtr3 Qtr4 2005 2006 2007 2008 2009 2010…
A:
Q: The following information is available for a company's cost of sales over the last five months.…
A: Given that Months Units Cost of salesJanuary 560…
Q: A company has the following demand history for six months: Month Demand January February 214 226…
A: The symmetric mean absolute percent errors (SMAPE) is given as, SMPAE=100%n∑i=1nFt-AtAt+Ft2 Using…
Q: Answer the question on the basis of the following short run demand and cost data for a specific…
A: answer is in next step
Q: XYZ Company, Annual Data Actual Demand. Forecasted Demand 15 14 15…
A: The formula for mean absolute deviation is MAD = (Σ|At – Ft|)/n, where At is the actual value and Ft…
Q: Given the Actual Demand from January to June of 2021, along with the forecasts based on three (3)…
A: Given Information: Consider the given dataset: Month Actual Method 1 Method 2 Method 3 JAN…
Q: Total cost and number of units in the first seven months of 2020 are given below. According to this…
A: a. Y=16000+52*X
Q: Table 1 HPF Demand in the last 12 periods Period Month Demand in '000 Period Month Demand in…
A: 1. Simple Moving Average with n = 4 Period Month Demand Simple moving average n = 4 Absolute…
Q: The Monthly demand for unit manufactured by the ABC Company has been as follows: Units 250 290 240…
A: Here, we are provided with a monthly data. Now, we know that, 4 weeks constitute of a month.…
Q: A gasoline mini-mart orders 26 copies of a monthly magazine. Depending on the cover story, demand…
A:
Q: Please help. Thank you. CSV file data is below. TSERofReturn AcmeRofReturn -1.99167…
A: Since you have posted a question with multiple sub-parts, we will solve first three subparts for…
Q: Historical Stock and Dividend Data for Boeing Date Price Dividend Date Price Dividend 1/2/2008…
A: Return from January 2 ,2008 to January 2, 2009
Q: The general fund budget (in billions of dollars) for a U.S. state for 1988 (period 1) to 2011…
A: Introduction: The response variable, time series value, as y.
Q: Hudson Co. reports the contribution margin income statement for 2019. HUDSON CO. Contribution Margin…
A:
Q: Demand for stereo headphones and MP3 players for joggers has caused Nina Industries to grow almost…
A: Given Month demand January 4000 February 4100 March 3800 April 4200 May 4850 June…
Q: The following table shows the quarterly sales of "Undercover Umbrellas" over a period of two years.…
A: We are given data and the first 4-point moving average
Q: The Board of Governors of the Federal Reserve System publishes data on mortgage debt outstanding by…
A: Given data Year Debt 1 529 2 554 3 559 4 602 5 672 6 669 7 600 8 538 9 490…
Q: The table below shows the one-year sales data for a certain part. Month Demand Month Demand…
A: Given information: The data presents the sample for the months January through December.
Q: What are the standard deviation values for each product of the America Legacy line for the year…
A: Here you're given four products which are as follows; Product B. Product A. Product C. Product D.…
Q: Coca-Cola Revenues ($ millions), 20es-2010 2007 Quarter Qtri Qtr2 Qtr3 Qtr4 2005 2006 2008 2009 2010…
A: Note: Hey there! Thank you for the question. As you have posted multiple sub-parts, we have solved…
Q: The general fund budget (in billions of dollars) for a U.S. state for 1988 (period 1) to 2011…
A: Introduction: The response variable is the budget, Tt, corresponding to the time period or year, t.
Q: Miami Central som:. 16. 15. (3500, 460), 1000 450 (3,860 900 400 800 350 (5) 700 * 300 (1000, 310)…
A: In this question we will use basic of algebra i.e equation of straight line when two points are…
Q: Based on the information in the following table, use the Naive Approach to forecast the demand for…
A: According to the Naive method of forecasting the forecasted value of any period is best given by the…
Q: Determine the production cost each month and the total cost for 4 months
A: Given:
Q: Based on the information in the following table, use the Naïve Approach to forecast the demand for…
A: According to the Naive approach, the best forecast for a future period is given by the observed…
Q: Price IndPrice PriceDif AdvExp Demand X1 X2 X4 X3 Y 3.85 3.80 -0.05 5.50 7.38 3.75 4.00 0.25 6.75…
A: Since you have asked multiple questions, we will solve the first question for you. If you want any…
Q: Company Y has the following inventory data: 20 units at $10 August 1 Beginning inventory 8 Purchases…
A:
Q: Provide a bar chart (with data labels rounded to two decimal points) showing the average demand for…
A: Consider the following table:- Weekday Date Sum of Daily Demand Average Mon…
Q: Using exponential smoothing, calculate the forecasts for months 2, 3, 4, 5, and 6. Thesmoothing…
A: Solution: Given information: α=0.2 Smoothing constant The forecast for month one is 245
Q: 89 july 223 Feb 57 august 286 mar 144 sept 212 april 221 oct 275 may 177 nov 188 june 280 dec 312 a)…
A: Month Demand Jan 89 Feb 57 mar 144 April 221 may 177 June 280 July 223 august 286…
Please can you help me answer that question
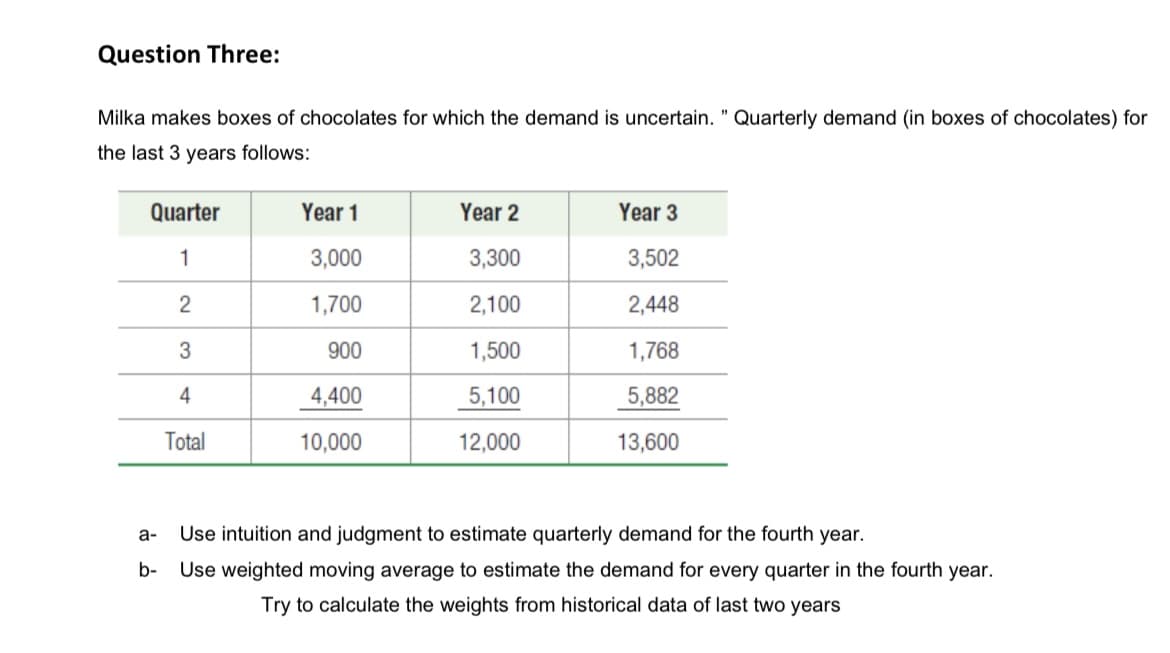
Trending now
This is a popular solution!
Step by step
Solved in 3 steps
- Annual interest yield refer to problem 13 .suppose the investor decides to increase the maximum invested in highest bonds to $3000 leave the other conditions unchanged .by how much will her maximum possible interest yield increase?QUESTION 3 Consider the basic food items consumed by a rural household: Food item Consumption Price (N$) June 2021 July 2021 June 2021 July 2021 Bread(loaves) 25 26 10.30 10.70 Cooking oil(litres) 5 6 45.00 59.40 Rice(kg) 10 8 34.50 36.20 Meat(kg) 15 16 88.90 92.20 Required to: a)Which food item has had the lowest relative quantity of consumption increase between the months of June and July? b) Which food item has had the lowest relative price increase between the months Juneand July 2021? c) Calculate and interpret a Paasche quantity index for July 2021.Table 1 HPF Demand in the last 12 periods Period Month Demand in '000 Period Month Demand in '000 1 January 37 7 July 43 2 February 40 8 August 47 3 March 41 9 September 56 4 April 37 10 October 52 5 May 45 11 November 55 6 June 50 12 December 54 The manager of the company wants to be certain enough OFC01 are available to complete orders promptly and they have adequate inventory in stock. During the last meeting, a number of forecast techniques have been discussed: Simple moving average n = 4 Weighted moving average with n=4 with the following weights from most recent periods: 0.4, 0.3, 0.2, 0.1 Exponential Smoothing with alpha = 0.2 Linear trend The manager would like to ascertain the best tools that he and his team can effectively manage the production processes. Among the above forecasting methods, which method should be used to forecast the demand for this product? Why? The…
- Question No. 2 Eleven sales executive trainees are assigned selling jobs right after their recruitment.After a fortnight they are withdrawn from their field duties and given a month’straining for executive sales. Sales executed by them in thousands of rupees beforeand after the training, in the same period are listed below:Sales BeforeTrainingSales AfterTraining23 2420 1919 2121 1818 2020 2218 2017 2023 2316 20a. Do these data indicate that the training has contributed to their performance?b. Find the 95 per cent confidence Interval of the training.Question 13 Find revenue AND demand function Show work neatlyThe problem is based on the following data given. Observations of the demand for a certain part stocked at a parts supply depot during the calendar year 2013 were ( as shown ). Using a four-month moving average, determine the two-step-ahead forecast for July through December 2013. (Hint: The two-step-ahead forecast for July is based on the observed demands in February through May.)
- The customer demand for a particular smart phone during Year 0 to Year 5 is given as 1,056,000, 1,032,000, 1,093,000, 1,024,000, 1,066,000, and 1,072,000. Using the Holt forecasting model with trend, what is the forecasted demand in year 10, where w = 0.4 and v = 0.5?a) 1,071,874b) 1,075,573c) 1,077,488d) 1,083,816Two pumps capable of delivering 100 hp to an agricultural application are being evaluated in a present economy study. The selected pump will only be utilized for one year, and it will have no market value at the end of the year. Pertinent data are summarized as given follows. If electric power costs $0.10 per kWh and the pump will be operated 4,000 hours per year, which pump should be chosen? Recall that 1 hp = 0.746 kW.Use this data and and generate a model of the annual maintenance expenses based on the age of the bug. If my bus is 4.1 years old, what are the projected annual maintenance costs? (Enter a whole number) Age of Bus (years) Annual Maintenance Cost ($) 2.4 350 2.3 370 2.4 480 3.1 520 3 590 5.8 550 4.8 750 3.8 800 3.6 790 4.9 950 5.5 915
- On April 1, 2009, in the middle of a recession, the government of the province of Ontario, Canada increased the provincial minimum wage from $8.75 to $9.50. What will the likely effect of this policy be? Question 32 options: Both the leftward shift in the labor demand curve and the higher minimum wage will lead to an increase in the unemployment rate. Low income workers will be better able to survive the recession at the new, higher wage rate. More people will be hired at the higher wage rate offsetting the effects of the recession. The higher wage will increase the supply of labor offsetting the effects of the recession.Question 13 Consider the following demand and supply functions: Demand: P = 100 – 2Q Supply: P = 10 + 4Q The equilibrium Q and P are Q = 15 and P = 70. Find the new equilibrium Q and P if the supply function shifts up by 100%.Ch 13. 3: Enterprise Industries produces Fresh, a brand of liquid laundry detergent. In order to manage its inventory more effectively and make revenue projections, the company would like to better predict demand for Fresh. To develop a prediction model, the company has gathered data concerning demand for Fresh over the last 30 sales periods (each sales period is defined to be a four-week period). The demand data are presented in table below concerning y (demand for Fresh liquid laundry detergent), x1 (the price of Fresh), x2 (the average industry price of competitors' similar detergents), and x3 (Enterprise Industries’ advertising expenditure for Fresh). To ultimately increase the demand for Fresh, Enterprise Industries’ marketing department is comparing the effectiveness of three different advertising campaigns. These campaigns are denoted as campaigns A, B, and C. Campaign A consists entirely of television commercials, campaign B consists of a balanced mixture of television and…