a) Complete the curve below by entering the values of areas under the curve, the values of 1, 2 and 3 standard deviations, based on the Empirical Rule. = O = _% % b) The education officer wants to know what percentage of students whose scores were greater than 100 marks.
a) Complete the curve below by entering the values of areas under the curve, the values of 1, 2 and 3 standard deviations, based on the Empirical Rule. = O = _% % b) The education officer wants to know what percentage of students whose scores were greater than 100 marks.

MATLAB: An Introduction with Applications
6th Edition
ISBN:9781119256830
Author:Amos Gilat
Publisher:Amos Gilat
Chapter1: Starting With Matlab
Section: Chapter Questions
Problem 1P

Related questions
Question
100%
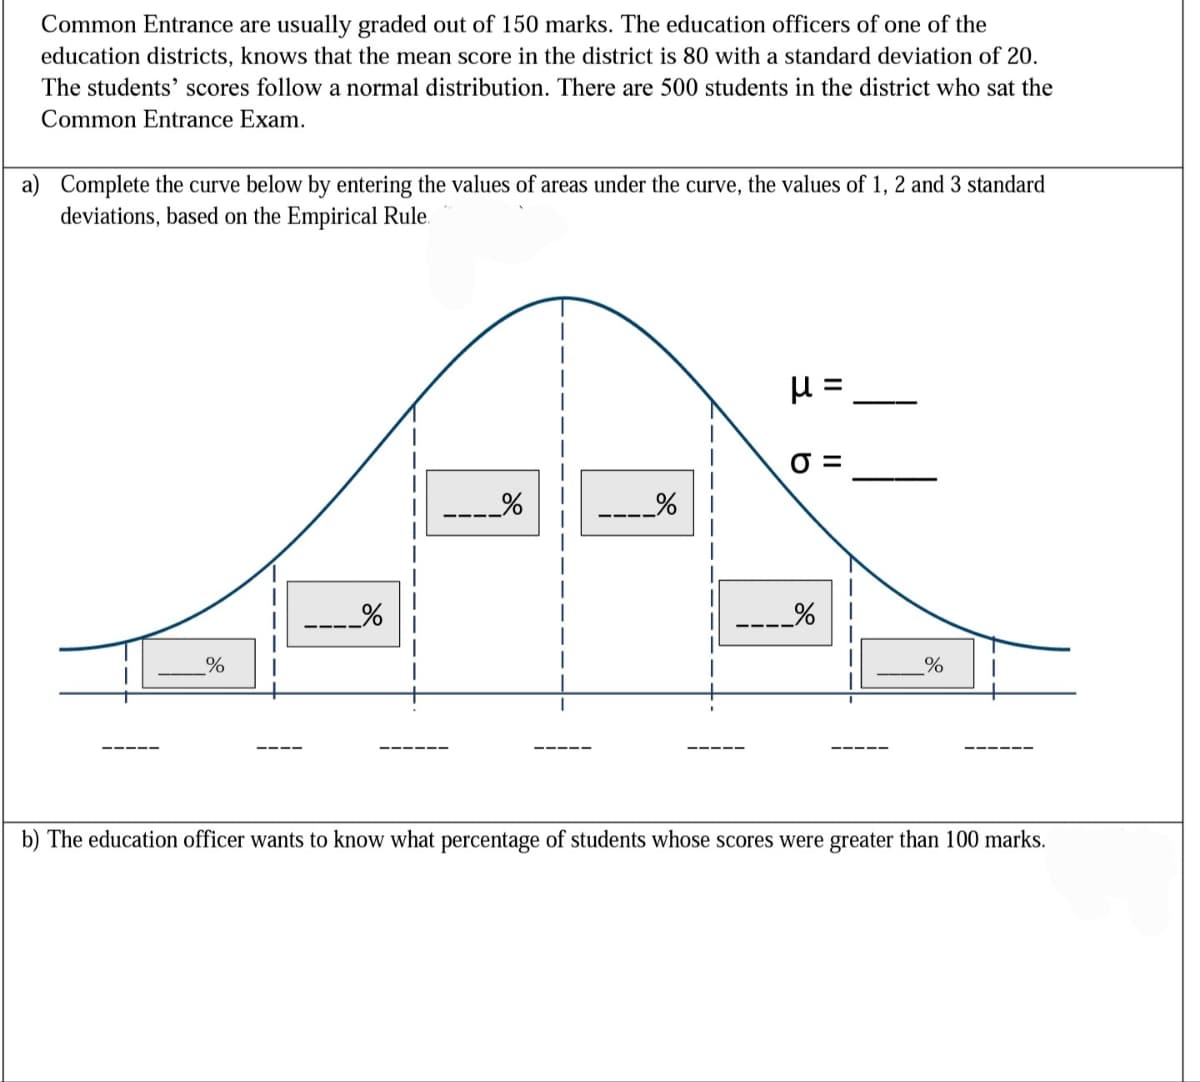
Transcribed Image Text:Common Entrance are usually graded out of 150 marks. The education officers of one of the
education districts, knows that the mean score in the district is 80 with a standard deviation of 20.
The students' scores follow a normal distribution. There are 500 students in the district who sat the
Common Entrance Exam.
a) Complete the curve below by entering the values of areas under the curve, the values of 1, 2 and 3 standard
deviations, based on the Empirical Rule.
_%
_%
b) The education officer wants to know what percentage of students whose scores were greater than 100 marks.
II
Expert Solution
This question has been solved!
Explore an expertly crafted, step-by-step solution for a thorough understanding of key concepts.

Step by step
Solved in 2 steps with 1 images

Recommended textbooks for you
MATLAB: An Introduction with Applications
Statistics
ISBN:
9781119256830
Author:
Amos Gilat
Publisher:
John Wiley & Sons Inc

Probability and Statistics for Engineering and th…
Statistics
ISBN:
9781305251809
Author:
Jay L. Devore
Publisher:
Cengage Learning

Statistics for The Behavioral Sciences (MindTap C…
Statistics
ISBN:
9781305504912
Author:
Frederick J Gravetter, Larry B. Wallnau
Publisher:
Cengage Learning
MATLAB: An Introduction with Applications
Statistics
ISBN:
9781119256830
Author:
Amos Gilat
Publisher:
John Wiley & Sons Inc
Probability and Statistics for Engineering and th…
Statistics
ISBN:
9781305251809
Author:
Jay L. Devore
Publisher:
Cengage Learning
Statistics for The Behavioral Sciences (MindTap C…
Statistics
ISBN:
9781305504912
Author:
Frederick J Gravetter, Larry B. Wallnau
Publisher:
Cengage Learning

Elementary Statistics: Picturing the World (7th E…
Statistics
ISBN:
9780134683416
Author:
Ron Larson, Betsy Farber
Publisher:
PEARSON

The Basic Practice of Statistics
Statistics
ISBN:
9781319042578
Author:
David S. Moore, William I. Notz, Michael A. Fligner
Publisher:
W. H. Freeman

Introduction to the Practice of Statistics
Statistics
ISBN:
9781319013387
Author:
David S. Moore, George P. McCabe, Bruce A. Craig
Publisher:
W. H. Freeman