Answer letter a with the red words. Provide a brief explanation
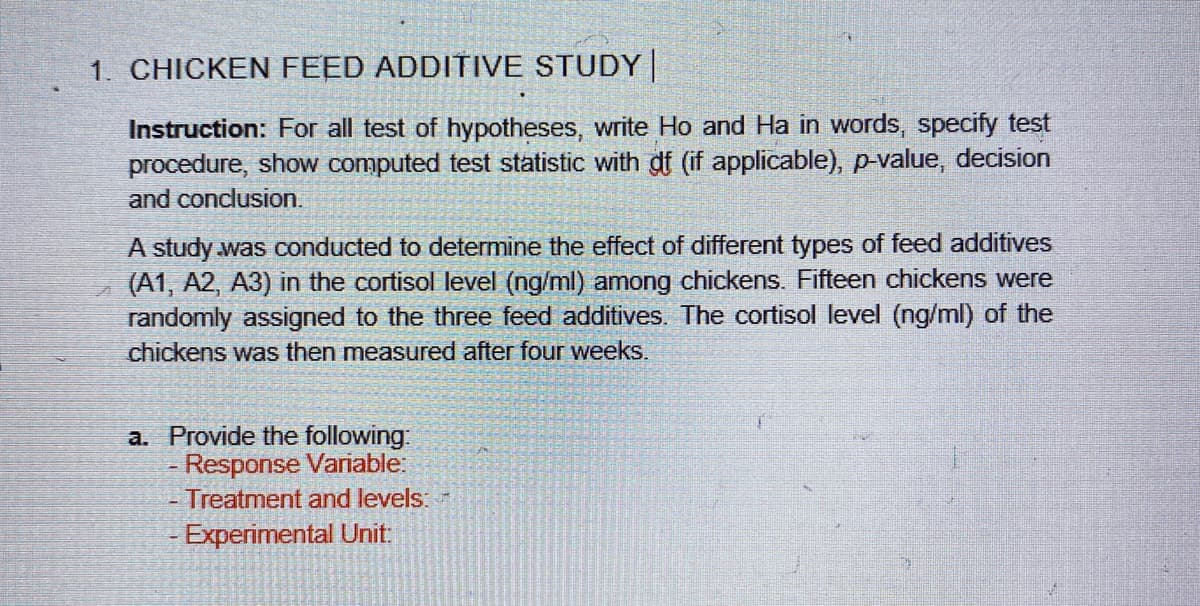
Q: Use the Wording of Final Conclusion flow chart interactive to answer the following question. When…
A: Solution-: We want to correct wording of the final conclusion?
Q: Use the Hypothesis Testing flow chart interactive to answer the following question. Which of the…
A:
Q: In a poll of 1000 randomly selected voters in a local election 170 voters were against school bond…
A:
Q: If ap A. Give an example (data), Type of Data (Qualitative/Quantitative), of Measurement (Nominal,…
A: The objective is to identify the type of Data and the level of measurement.
Q: The mean and standard deviation of the sample mean is given by Mean= Hx = µ = 2560 Standard…
A:
Q: 23. If you are doing a two-tailed test and alpha = .05, find the critical value of r from the table:
A: Correlation is an associational statistic.
Q: 7. What is the minimum score that a student should have to be awarded? Show vour solution and shade…
A: 7 Given information: The mean is 80.51 and the standard deviation is 10.2. The principal decided…
Q: a) What is the probability that the system works? Assume the components fail independently. b) Given…
A:
Q: If N= 36,500 and n = 387, what is the proportion?
A: Proportion is defined as the ratio of two similar quantities. Here, the proportion is defined as the…
Q: e prubability distribution for the given random variable. (Round all probabilities to four decimal…
A: From the given information, the number of defective joysticks is 28
Q: A data set includes data from student evaluations of courses. The summary statistics are n = 94, x =…
A:
Q: variance is assuh Date of Submission: April 12, 2022 PERFORMANCE TASK We make decisions every day.…
A: We need to create a problem of the hypothesis testing which has sample size less than 30 and the…
Q: 10. Sketch a scatterplot for these data: 10 8 4 3 2 1 1 2 3 4 7 8. 9. 10
A: We have given that the data of 7 participants A, B, C, D, E, F and G.
Q: 1. How does the cost of shipping a standard-sized crate relate to the distance of the destination?…
A: Given that The excel output using regression is
Q: Grand mean=14.82 Calculate effect size using the formula d=(M-u)/
A: Analysis of variance is a useful inferential statistic.
Q: Problem 1. The Rockwell hardness of a metal is determined by impressing a hardened point into the…
A: Given: Mean = 70 Standard deviation = 3
Q: The grades of seven students in the first and second grading periods are shown below. 80 78 76 82 84…
A: Given the grades of seven students in the first and second grading periods.
Q: discuss the shape of the distribution of the variable WEIGHT.
A: From histogram we want to tell the shape of distribution
Q: The grades of seven students in the first and second grading periods are shown below. 80 78 76 82 84…
A: Given Information: x 80 78 76 82 84 85 75 y 84 79 75 86 84 77 78
Q: Listed below are the lead concentrations (in ug/g) measured in different Ayurveda medicines.…
A: Solution-: (a) We identify the null and alternative hypothesis (b) Identify the test statistic (c)…
Q: 10% of all Americans live in poverty. If 47 Americans are randomly selected, find the probability…
A: Let X be the random variable from binomial distribution with probability (p) = 10% = 0.10 and sample…
Q: Compute
A: The given information is presented in the following table as follows: Column 1…
Q: student beginning her senior year has accumulated 90 credits and has a C-minus cumulative grade…
A:
Q: a. experiences neither depression nor weight gain. b. experiences depression given that the patient…
A: We have given that P( depression) = 0.38 P( weight gain ) = 0.28 P( depression and weight gain ) =…
Q: HYPOTHESIS TESTI s: Identify a product available in your home. Measure the weight (g) or length (cm)…
A: Given that Population mean μ =200 Level of significance =5%=0.05
Q: Use this set of data to answer questions #1 - #17. You are conducting a correlational study.…
A: From the provided information, Number of participants = 7 Level of significance (α) = 0.05
Q: JIUgy.com/2ommon-assessment-delivery/start/5808331814?action3Donresume&submissionld%3D835482324…
A:
Q: n an experiment, college students were given either four quarters or a $1 bill and they could either…
A:
Q: Let the sample size of leg strengths be 7 and the sample mean and sample standard deviation be 630…
A: Given information Hypothesized mean µ = 600 watts Sample size (n) = 7 Mean x̅ = 630 watts Standard…
Q: WHICH OF THE FOLLOWING ARE DISCRETE PROBABILITY DISTRIBUTION? IF IT IS NOT A DISCRETE PROBABILITY…
A: (1) X 1 2 3 4 5 P(x) 0.10 0.20 0.25 0.40 0.05 then, We have to check the given…
Q: Find the critical values x and x? for the given confidence level c and sample size n. c= 0.98, n= 15…
A: Given that Confidence level=98%=0.98=c Sample size=n=15
Q: GDP Country X 400 350 300 250 200 150 100 50 a1 a2 a3 a4 a1 a2 a 04 a1 a2 a 04 Q1 02 a 94 a1 a2 aa…
A: Solution: As per our guidelines only three parts should be answered.
Q: for a certain company, the monthy percentages ot al hipments received on time over the past 12…
A: a) Enter the data into the excel sheet as follows: a) The time series plot is constructed below.…
Q: 21. Calculate the Pearson Correlation Coefficient (r): (SHOW YOUR WORK)
A: For the given data ( 21 ) r = ?
Q: 80 82 75 78 79 64 A74 56 61 75 25 85 61
A: Arranging the given data set into the ascending order: 56, 56, 59, 59, 61, 61, 64, 64, 70, 71, 71,…
Q: 2. SWIMMER'S FLEXIBILITY STUDY Swimming requires complete body movement as defined in sports…
A: T test are used to measure the mean significance between the sample and population. T test are used…
Q: Roy is investigating how long his phone's battery lasts (in hours) for various brightness levels (on…
A: For the given data Correlation ( r ) =?
Q: 1. Determine sufficient statistics in the case of a random sample of size n from the uniform (a)…
A:
Q: An experiment consists of tossing a die and flipping two coins.Let X be a random variable whose…
A: Hello! As you have posted more than 3 sub parts, we are answering the first 3 sub-parts. In case…
Q: Suppose that the time students wait for a bus can be described by a uniform random variable X, where…
A: X~ U (15 ,55 ) Find ( a ) P ( 15<X<25 ) =? ( B ) p ( x>=25 ) =?
Q: The blue catfish (Ictalurus Furcatus) is the largest species of North American catfish. The current…
A:
Q: 17. How did you make the determination in Question #16?
A: Correlation coefficient is a measure of statistical association between continuous variables.
Q: which of the following statements is true about probablity (a) A probability of zero means that an…
A: Probability of an event is the chance of occurrence of that event.
Q: Tweet tweet: An article reported that 73% of companies have Twitter accounts. An economist thinks…
A:
Q: 26. If the Pearson Correlation Coefficient that you calculated in #21 remains the same, but you had…
A: For the given data ( 26 ) Write the decision
Q: 2. Consider the foot length and foot width of six female grade 4 students in Morning Star Montessori…
A: y is a dependent variable and x is an independent variable. The least square regression line is…
Q: You plan to draw distinct cards from a regular deck that I hold. a. How many number of ways of…
A: We know that the regular deck card contains 52 cards.
Q: Solve in digital format please Theoretically, a milk carton packer pours 1000 ml. per unit. A…
A: Given that Hypothesized Population Mean (\mu)(μ) = 10001000 Sample Standard Deviation (s)(s) =…
Q: The table below shows the heights of all fourth-grade students in a particular school, and the…
A: The given table below shows the heights of all fourth-grade students in a particular school, and the…
Q: In 1999, the average percentage of women who received prenatal care per country was 80.1%. The table…
A:
Step by step
Solved in 2 steps
- You want to conduct a test to determine whether there are significant differences in the mean impurity levels for polymers produced with three different catalysts. Which statistical test is appropriate for this scenario? Select one: a. paired t test b. one-sample t test c. one-way ANOVA d. two-sample t testA quality-control technician collects a random sample of 10 rivets from each of four different suppliers and subjects them to a shear strength test to failure 1. The dependent variable in this scenario is quantitative. (enter T for true or F for false) ____ 2. The independent variable in this scenario is quantitative. (enter T for true or F for false) _____ 3. To run an ANOVA analysis in for this scenario, what is the sample size? _____4. Captopril is a drug designed to lower systolic blood pressure. When subjects were treated with this drug, their systolic blood pressure readings (in mm Hg) were measured before and after the drug was taken. Results are given in the accompanying table (based on data from “Essential Hypertension: Effect of an Oral Inhibitor of Angiotensin-Converting Enzyme”, by MacGregor et al., BMJ, Vol. 2). Using a 0.01 significance level, is there sufficient evidence to support the claim that captopril has an effect on systolic blood pressure? Explain why statistical methods from Z-interval, Z-test, T-interval or T-test –cannot be used for this problem. Then, use the sign test to conduct the required test in R studio. Please show your work.
- What is the relationship between power and N, size of real effect, and alpha level? How does power fit into the hypothesis testing process? Compare the z test and t test for single samples. What are the advantages and disadvantages of each? Discuss. In presenting the t test for single samples, it was necessary to introduce the concept of degrees of freedom. However, no such discussion was needed in presenting the z test for single samples. What is the explanation of this difference?Interpret the statistical significance for gas price p-value = 3.09e-07, at all three levels 1%,5%,10% ?7. Gravetter/Wallnau/Forzano, Essentials - Chapter 12 - End-of-chapter question 10 The following summary table presents the results from an ANOVA comparing five treatment conditions with n = 5 participants in each condition. Complete all missing values. (Hint: Start with the df column.) Source SS df MS F Between treatments 125 Within treatments Total 1500
- Two types of valves are being tested to determine if there is a difference in pressure tolerances. Fifteen out of a random sample of 100 of Valve A cracked under 4,500 psi. Six out of a random sample of 100 of Valve B cracked under 4,500 psi. Test at a 5% level of significanceWhat are the corresponding degrees of freedom and critical value for a within-subjects ANOVA with 2 conditions, 7 subjects in each condition, and α = 0.01? a) BG: b) BS: c) Error: d) Total: e) critical valuein each of several consecutive days of production of cola cans 500 cans are tested and the number of defects of each day are listed below. a. use the given process data to construct a control chart for p. b. use the three out of control criteria and determine whether the process is within statistical control. options for b: yes because all the criteria are satisfied, no because there is at least one point lying outside of the region between upper and lower control limits, yes because none of the criteria are satisfied, or no because there is a pattern trend or cycle that is obviously not random and there are eight or more consecutive points all above or below the central line. c. what action should be taken? The manufacturer should review their production process and attempt to remedy the cause of increasing variation in proportions of defects The manufacturer should proceed as before because the number of defects is increasing The manufacturer should review their production process…
- A one-way between subjects ANOVA produces dftotal = 29 and dfwithin = 27. For this analysis, how many treatment conditions are being compared? a) 1 b) 2 c) 3 d) Cannot determine1. Identify the for steps of a hypothesis test as presented in this chapter. 2. Define the alpha level and the critical region for a hypothesis test. 3. Define a Type I error and a Type II error and explain the consequences of each. 4. If the alpha level is changed from a=.05 to a = .01 a. What happens to the boundaries for the critical region? b. What happens to the probability of Type I error?An experiment was conducted to investigate the effects of the concentrations of sulfuric acid (H2SO4) and calcium chloride (CaCl2) on the amount of black mud precipitate in the treatment of alkaline wastewater. There were three levels of each concentration, and two replicates of the experiment were made at each combination of levels. The relevant statistical analysis is provided in the following table: (image) a) The appropriate statistical analysis to test would be: I. One-way ANOVA II. Two-way ANOVA III. Three-way ANOVA IIIV. Two-Sample t-test b) Does there appear to be an interaction between concentration of sulfuric acid and calcium chloride at the .05 level? What does this say about the additive model? c) Can the effect of concentration of sulfuric acid on amount of black mud precipitate in the treatment of alkaline wastewater be described by interpreting the main effects of concentration of sulfuric acid? If so, interpret the main effects at the .05 level, including the…