
MATLAB: An Introduction with Applications
6th Edition
ISBN: 9781119256830
Author: Amos Gilat
Publisher: John Wiley & Sons Inc
expand_more
expand_more
format_list_bulleted
Related questions
Question
Can you explain 3.130 part a and b? Thank you

Transcribed Image Text:**Title: Using Bootstrap Distributions to Estimate and Interpret Data**
**Section: Exercise on Confidence Intervals and Bootstrap Distribution**
**Page 273**
1. **Define a Relevant Parameter:**
- Identify a parameter of interest and express it using correct statistical notation.
2. **Estimate the Sample Statistic Using Bootstrap:**
- Utilize the bootstrap distribution to approximate the sample statistic. Ensure that correct statistical notation is used.
3. **Estimate a 99% Confidence Interval:**
- Apply the bootstrap distribution to calculate a 99% confidence interval for the parameter.
4. **Interpret the Confidence Interval:**
- Contextualize and explain the meaning of the confidence interval within the given scenario.
5. **Evaluate Evidence from the Interval:**
- Determine whether the interval shows that concentrations of the pesticide 3-PBA are lower when eating organic. Provide a rationale for your answer.
6. **Draw Conclusions on Organic Eating and Pesticide Concentration:**
- Assess whether it can be concluded that consuming organic foods results in lower 3-PBA concentrations. Explain your reasoning.
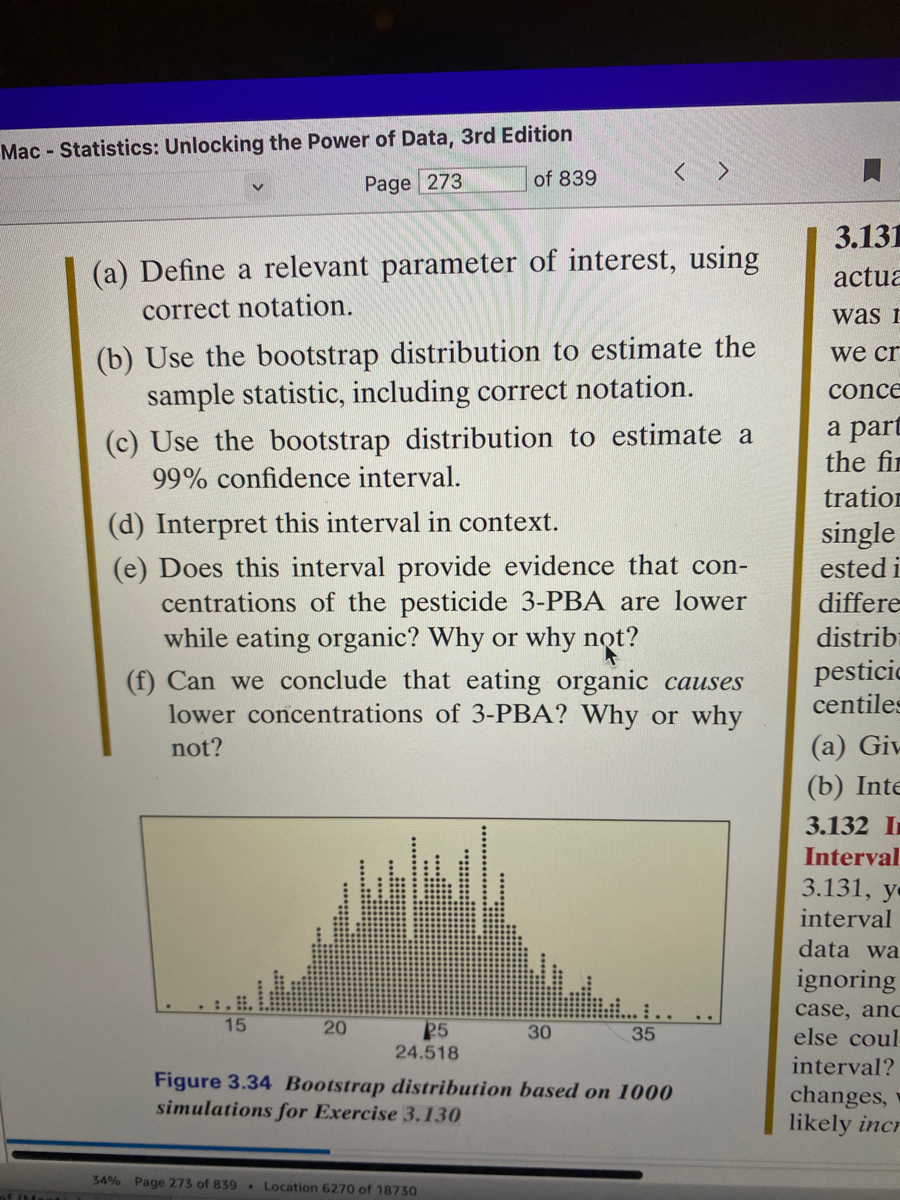
**Figure 3.34: Bootstrap Distribution**
- **Description:**
- The figure displays a bootstrap distribution of a dataset based on 1000 simulations. This histogram represents the variability of the sample statistic for Exercise 3.130.
- The distribution appears slightly right-skewed, with the peak around 24.518 and values ranging from approximately 10 to 40.
**Note:** This exercise helps in understanding how bootstrap methods can be employed in statistics to estimate parameters and draw inferences about data confidently.
.](https://content.bartleby.com/qna-images/question/9ceadcea-1d0c-46b9-af7a-48f9b0bf3d90/b0ab2909-8331-4cb8-bcb4-b8e12c6f3011/rt87u9h_processed.jpeg)
Transcribed Image Text:**Eating Organic and 3-PBA Levels**
We first study 3-PBA, a commonly used insecticide found in grains, fruits, and vegetables. How much higher are 3-PBA concentrations while not eating organic versus eating organic? A bootstrap distribution based on 1000 samples of the mean concentration before the switch minus the mean concentration after switching to organic is shown in Figure 3.34.
**References:**
- Mata, J., Frank, R., and Gigerenza, G., “Symptom Recognition of Heart Attack and Stroke in Nine European Countries: A Representative Survey”, *Health Expectations*, 2012; doi: 10.1111/j.1369-7625.2011.00764.x.
- Magner, J., Wallberg, P., Sandberg, J., and Cousins, A.P. (2015). “Human exposure to pesticides from food: A pilot study,” *IVL Swedish Environmental Research Institute*. https://www.coop.se/PageFiles/429812/Coop%20Ekoeffekten_Report%20ENG.pdf, January 2015.
- For illustrative purposes we will assume the measurements were far enough apart to be unrelated.
- [YouTube Link](https://www.youtube.com/watch?v=oB6fQuymyKC8).
Expert Solution
This question has been solved!
Explore an expertly crafted, step-by-step solution for a thorough understanding of key concepts.

This is a popular solution

Trending nowThis is a popular solution!

Step by stepSolved in 3 steps

Knowledge Booster

Similar questions
arrow_back_ios
arrow_forward_ios
Recommended textbooks for you
- MATLAB: An Introduction with ApplicationsStatisticsISBN:9781119256830Author:Amos GilatPublisher:John Wiley & Sons Inc
 Probability and Statistics for Engineering and th...StatisticsISBN:9781305251809Author:Jay L. DevorePublisher:Cengage Learning
 Statistics for The Behavioral Sciences (MindTap C...StatisticsISBN:9781305504912Author:Frederick J Gravetter, Larry B. WallnauPublisher:Cengage Learning
  Elementary Statistics: Picturing the World (7th E...StatisticsISBN:9780134683416Author:Ron Larson, Betsy FarberPublisher:PEARSON
 The Basic Practice of StatisticsStatisticsISBN:9781319042578Author:David S. Moore, William I. Notz, Michael A. FlignerPublisher:W. H. Freeman
 Introduction to the Practice of StatisticsStatisticsISBN:9781319013387Author:David S. Moore, George P. McCabe, Bruce A. CraigPublisher:W. H. Freeman
MATLAB: An Introduction with Applications
Statistics
ISBN:9781119256830
Author:Amos Gilat
Publisher:John Wiley & Sons Inc
Probability and Statistics for Engineering and th...
Statistics
ISBN:9781305251809
Author:Jay L. Devore
Publisher:Cengage Learning
Statistics for The Behavioral Sciences (MindTap C...
Statistics
ISBN:9781305504912
Author:Frederick J Gravetter, Larry B. Wallnau
Publisher:Cengage Learning
Elementary Statistics: Picturing the World (7th E...
Statistics
ISBN:9780134683416
Author:Ron Larson, Betsy Farber
Publisher:PEARSON
The Basic Practice of Statistics
Statistics
ISBN:9781319042578
Author:David S. Moore, William I. Notz, Michael A. Fligner
Publisher:W. H. Freeman
Introduction to the Practice of Statistics
Statistics
ISBN:9781319013387
Author:David S. Moore, George P. McCabe, Bruce A. Craig
Publisher:W. H. Freeman