A department store has recorded the sales of the best selling can opener model during the last 6 months. Observed values of the can opener sales are:
A department store has recorded the sales of the best selling can opener model during the last 6 months. Observed values of the can opener sales are:

Chapter6: Exponential And Logarithmic Functions
Section6.8: Fitting Exponential Models To Data
Problem 2TI: Sales of a video game released in the year 2000 took off at first, but then steadily slowed as time...

Related questions
Question
Help ASAP
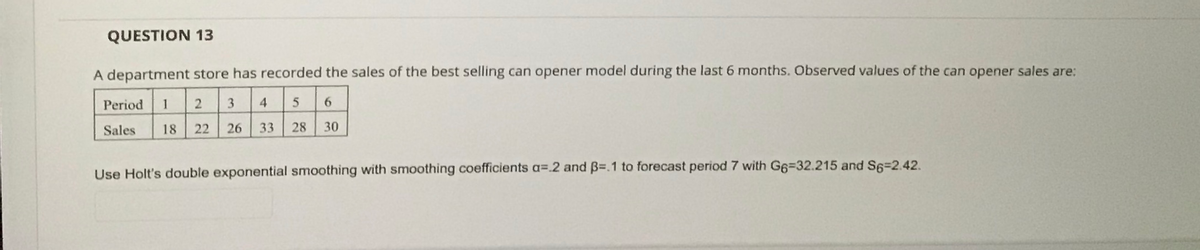
Transcribed Image Text:QUESTION 13
A department store has recorded the sales of the best selling can opener model during the last 6 months. Observed values of the can opener sales are:
Period
1
3
4
5
6
Sales
18
22
26
33
28
30
Use Holt's double exponential smoothing with smoothing coefficients a=.2 and B=.1 to forecast period 7 with G6=32.215 and S6=2.42.
Expert Solution
This question has been solved!
Explore an expertly crafted, step-by-step solution for a thorough understanding of key concepts.

Step by step
Solved in 2 steps with 1 images

Knowledge Booster


Learn more about
Need a deep-dive on the concept behind this application? Look no further. Learn more about this topic, statistics and related others by exploring similar questions and additional content below.Recommended textbooks for you

Linear Algebra: A Modern Introduction
Algebra
ISBN:
9781285463247
Author:
David Poole
Publisher:
Cengage Learning

Functions and Change: A Modeling Approach to Coll…
Algebra
ISBN:
9781337111348
Author:
Bruce Crauder, Benny Evans, Alan Noell
Publisher:
Cengage Learning
Linear Algebra: A Modern Introduction
Algebra
ISBN:
9781285463247
Author:
David Poole
Publisher:
Cengage Learning
Functions and Change: A Modeling Approach to Coll…
Algebra
ISBN:
9781337111348
Author:
Bruce Crauder, Benny Evans, Alan Noell
Publisher:
Cengage Learning

Algebra & Trigonometry with Analytic Geometry
Algebra
ISBN:
9781133382119
Author:
Swokowski
Publisher:
Cengage

Trigonometry (MindTap Course List)
Trigonometry
ISBN:
9781337278461
Author:
Ron Larson
Publisher:
Cengage Learning

College Algebra
Algebra
ISBN:
9781305115545
Author:
James Stewart, Lothar Redlin, Saleem Watson
Publisher:
Cengage Learning