Values of modulus of elasticity (MOE, the ratio of stress, i.e., force per unit area, to strain, i.e., deformation per unit length, in GPa) and flexural strength (a measure of the ability to resist failure bending, in MPa) were determined for a sample of concrete beams of a certain type, resulting in the following data (read from a graph in the article "Effects of Aggregates and Microfillers on the Flexural Properties of Concrete"t). MOE 29.8 33.2 33.7 35.3 35.5 36.1 36.2 36.3 37.5 37.7 38.7 38.8 39.6 41.0 Strength 5.9 7.2 7.3 6.3 7.9 9.0 8.1 6.8 7.0 7.6 6.8 6.5 7.0 6.3 MOE 42.8 42.8 43.5 45.6 46.0 46.9 48.0 49.3 51.7 62.6 69.8 79.5 80.0 Strength 8.2 8.7 7.8 9.7 7.4 7.7 9.7 7.8 7.7 11.6 11.3 11.8 10.7 (a) Construct a stem-and-leaf display of the MOE values. (Round each value down to the nearest whole number. Enter numbers from smallest to largest separated by spaces. Enter NONE for s with no values. Split the stems, placing leaves 0 to 4 on the first stem and leaves 5 to 9 on the second stem of the same value. Use the tens digit as the stem and the ones digit as the leat stem leaf 2
Values of modulus of elasticity (MOE, the ratio of stress, i.e., force per unit area, to strain, i.e., deformation per unit length, in GPa) and flexural strength (a measure of the ability to resist failure bending, in MPa) were determined for a sample of concrete beams of a certain type, resulting in the following data (read from a graph in the article "Effects of Aggregates and Microfillers on the Flexural Properties of Concrete"t). MOE 29.8 33.2 33.7 35.3 35.5 36.1 36.2 36.3 37.5 37.7 38.7 38.8 39.6 41.0 Strength 5.9 7.2 7.3 6.3 7.9 9.0 8.1 6.8 7.0 7.6 6.8 6.5 7.0 6.3 MOE 42.8 42.8 43.5 45.6 46.0 46.9 48.0 49.3 51.7 62.6 69.8 79.5 80.0 Strength 8.2 8.7 7.8 9.7 7.4 7.7 9.7 7.8 7.7 11.6 11.3 11.8 10.7 (a) Construct a stem-and-leaf display of the MOE values. (Round each value down to the nearest whole number. Enter numbers from smallest to largest separated by spaces. Enter NONE for s with no values. Split the stems, placing leaves 0 to 4 on the first stem and leaves 5 to 9 on the second stem of the same value. Use the tens digit as the stem and the ones digit as the leat stem leaf 2

Mathematics For Machine Technology
8th Edition
ISBN:9781337798310
Author:Peterson, John.
Publisher:Peterson, John.
Chapter29: Tolerance, Clearance, And Interference
Section: Chapter Questions
Problem 16A: Spacers are manufactured to the mean dimension and tolerance shown in Figure 29-12. An inspector...

Related questions
Question
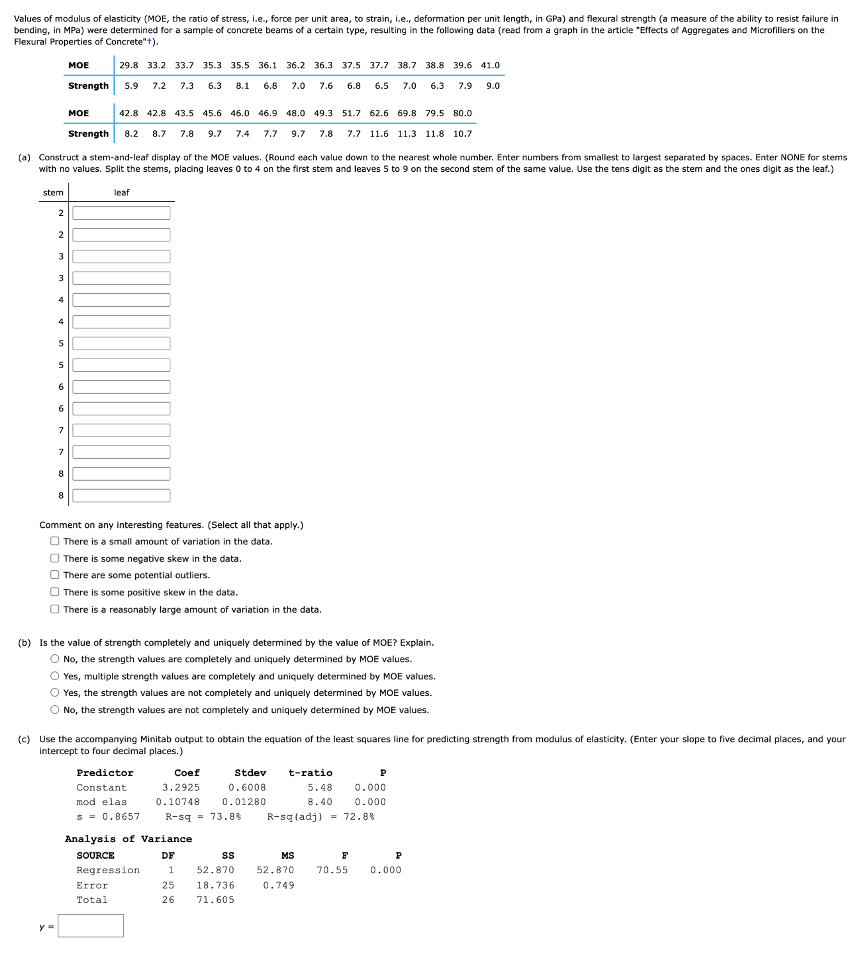
Transcribed Image Text:Values of modulus of elasticity (MOE, the ratio of stress, i.e., force per unit area, to strain, i.e., deformation per unit length, in GPa) and flexural strength (a measure of the ability to resist failure in
bending, in MPa) were determined for a sample of concrete beams of a certain type, resulting in the following data (read from a graph in the article "Effects of Aggregates and Microfillers on the
Flexural Properties of Concrete"t).
MOE
29.8 33.2 33.7 35.3 35.5 36.1 36.2 36.3 37.5 37.7 38.7 38.8 39.6 41.0
Strength
5.9
7.2
7.3
6.3
8.1
6.8
7.0
7.6
6.8
6.5
7.0
6.3
7.9
9.0
MOE
42.8 42.8 43.5 45.6 46.0 46.9 48.0 49.3 51.7 62.6 69.8 79.5 80.0
Strength
8.2
8.7
7.8
9.7
7.4
7.7
9.7
7.8
7.7 11.6 11.3 11.8 10.7
(a) Construct a stem-and-leaf display of the MOE values. (Round each value down to the nearest whole number. Enter numbers from smallest to largest separated by spaces. Enter NONE for stems
with no values. Split the stems, plading leaves 0 to 4 on the first stem and leaves 5 to 9 on the second stem of the same value. Use the tens digit as the stem and the ones digit as the leaf.)
stem
leaf
2
3
3
4
7
8.
8
Comment on any interesting features. (Select all that apply.)
O There is a small amount of variation in the data.
O There is some negative skew in the data.
O There are some potential outliers.
There is some positive skew in the data.
There is a reasonably large amount of variation in the data.
(b) Is the value of strength completely and uniquely determined by the value of MOE? Explain.
O No, the strength values are completely and uniquely determined by MOE values.
O Yes, multiple strength values are completely and uniquely determined by MOE values.
O Yes, the strength values are not completely and uniquely determined by MOE values.
No, the strength values are not completely and uniquely determined by MOE values.
(c) Use the accompanying Minitab output to obtain the equation of the least squares line for predicting strength from modulus of elasticity. (Enter your slope to five decimal places, and your
intercept to four decimal places.)
Predictor
Coef
Stdev
t-ratio
P
Constant
3.2925
0.6008
5.48
0.000
mod elas
0.10748
0.01280
8.40
0.000
S = 0.8657
R-sq = 73.8%
R-sq (adj) = 72.88
Analysis of Variance
SOURCE
DF
MS
Regression
1
52.870
52.870
70.55
0.000
Error
25
18.736
0.749
Total
26
71.605
y =
2.
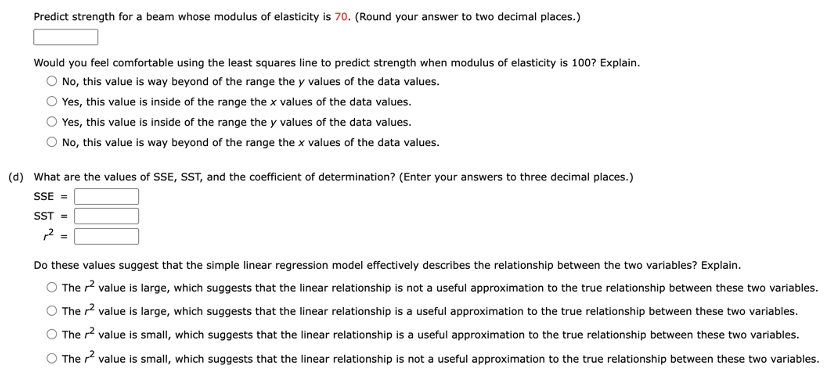
Transcribed Image Text:Predict strength for a beam whose modulus of elasticity is 70. (Round your answer to two decimal places.)
Would you feel comfortable using the least squares line to predict strength when modulus of elasticity is 1007 Explain.
O No, this value is way beyond of the range the y values of the data values.
Yes, this value is inside of the range the x values of the data values.
Yes, this value is inside of the range the y values of the data values.
No, this value is way beyond of the range the x values of the data values.
(d) What are the values of SSE, SST, and the coefficient of determination? (Enter your answers to three decimal places.)
SSE =
SST =
Do these values suggest that the simple linear regression model effectively describes the relationship between the two variables? Explain.
The 2 value is large, which suggests that the linear relationship is not a useful approximation to the true relationship between these two variables.
The r? value is large, which suggests that the linear relationship is a useful approximation to the true relationship between these two variables.
The r2 value is small, which suggests that the linear relationship is a useful approximation to the true relationship between these two variables.
The r value is small, which suggests that the linear relationship is not a useful approximation to the true relationship between these two variables.
Expert Solution
This question has been solved!
Explore an expertly crafted, step-by-step solution for a thorough understanding of key concepts.

This is a popular solution!

Trending now
This is a popular solution!

Step by step
Solved in 2 steps

Recommended textbooks for you
Mathematics For Machine Technology
Advanced Math
ISBN:
9781337798310
Author:
Peterson, John.
Publisher:
Cengage Learning,
Mathematics For Machine Technology
Advanced Math
ISBN:
9781337798310
Author:
Peterson, John.
Publisher:
Cengage Learning,