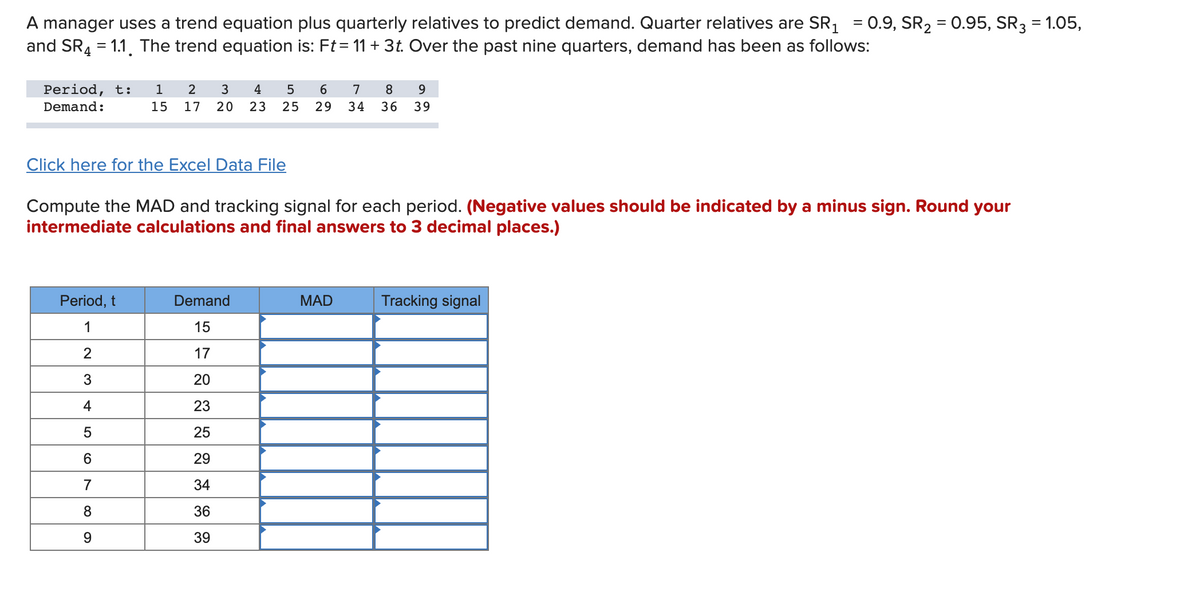
A manager uses a trend equation plus quarterly relatives to predict demand. Quarter relatives are SR, = 0.9, SR2 = 0.95, SR3 = 1.05, and SR, = 1.1. The trend equation is: Ft = 11 + 3t. Over the past nine quarters, demand has been as follows:
Q: The median home value in Wisconsin and Michigan (adjusted for inflation) are shown below. Year…
A: The median home value in Wisconsin and Michigan are as follows: Thus, considering the years on…
Q: Amex PLC has gathered following information on the sales of face mask from April 2020 to September…
A: We will first find the regression equation and then predict for October 2020. Month(x) Sales(y)…
Q: mex PLC has gathered following information on the sales of face mask from April 2020 to September…
A: a).The equation of trend line is given as- μt=a+bt Let us assign the month April, May, June, July,…
Q: 55. Below are given figures of production (lakh tonnes) of a sugar factory : 2014 2012 2013 2015…
A:
Q: Example 18.14 The linear trend of sales of a company is Rs 6,50,000 in 1995 and it rises by Rs…
A:
Q: Example 18.16) The sales of a company (in lakh of Rs) for the seven years are given below: Year 1990…
A:
Q: The median home value in Tennessee and Connecticut (adjusted for inflation) are shown below: Year…
A:
Q: For each of the following data sets, construct a scatter plot, draw a line of best fit, use two…
A:
Q: Sales for last 10 weeks are shown in the table below. Plot the data and visually check to see…
A: Given data is :
Q: The median home value in Arkansas and Alabama (adjusted for inflation) are shown below. Year…
A: We will evaluate required data as shown below
Q: The following data show the quarterly sales of a major auto manufacturer for the years I through 3.…
A: Ans : As from the given data , We have our answers Q. 26) C Ans : Sales = 567 + 150(4) = 1167 Which…
Q: The median home value in Mississippi and Nevada (adjusted for inflation) are shown below. Year…
A: We need to solve the given questions from the median home value given below.
Q: You are given the following trend equation : Y = 50+.8.X Origin 2012, X units one year; Y units -…
A: Solution is given in the picture:
Q: Fit a straight line trend by the method of least squares and estimate the sales for 2004 and 2005,…
A: Given:
Q: The following Table gives the profits of a concern for 5 years ending 1983 : Year 2009 2010 2011…
A: Equation, Y= ABx taking log on both the sides, LogY= LogA+X*logB y= a+b*X Where y= logY a= logA b=…
Q: 51. Below are given the annual production figures (in thousand tonnes) of a fertiliser factory: Year…
A:
Q: Amex PLC has gathered following information on the sales of face mask from April 2020 toSeptember…
A: Let the April be denoted by 1, May by 2 and so on. Then, the given data: Month, x Sales, ut 1…
Q: Determine the equation of the trend line for the data shown below on Canadian balance of payments…
A:
Q: Determine the linear trend equation and then interpret it.
A: Based on the excel regression
Q: Convert the following monthly trend equation into the annual one : 2 + 0.0125X 1 month, and Y unit…
A:
Q: The table below shows the revenue in billion dollars at theme parks in a certain country. Make a…
A: Use the excel to draw the trend line:
Q: r 31. You are given the following trend equation: Y 50 +.8X %3D Origin 2012 ; X units one year; Y…
A:
Q: hudson Marine has been an authorized dealer for c&d marine radios for the past sevenyears. the…
A: a) A step-by-step procedure to draw the time series plot using MINITAB software: Choose Graph >…
Q: Perform a Trend and Seasonal analysis with the following data. Include the trend formula and the…
A: Hello. Since you have asked multiple questions, we will solve the first question for you. If you…
Q: Laptop sales for Asus Company over the last 7 weeks are shown in the table below. Plot the data, and…
A: Equation of the linear trend line: Excel Procedure: Enter weeks and unit sales in…
Q: Amex PLC has gathered following information on the sales of face mask from April 2020 to September…
A: Linear trend equation forecast method entails finding the linear equation that fits the given data…
Q: 18. Fit a straight line trend for the following data. 1997 1996 1998 1999 2000 Year: Per capita: 25…
A:
Q: Example 11: Assuming that trend is absent, calculate the seasonal indices for various quarters in…
A:
Q: The equation for yearly sales (in '000 Rs.) for a commodity with the year, 1997 as origin is Yc 91.6…
A:
Q: Which of the following best describes the trend of the graph? Scatterplot of Pulse Rate vs Height…
A: There are three trends which are possible in a graph: Positive linear trend (Positive correlation):…
Q: The median home value in Pennsylvania and Massachusetts (adjusted for inflation) are shown below.…
A:
Q: Convert the following annual trend equation into a monthly order : Yc = 60 + 3.6X + 2.4X²
A:
Q: Below are given the annual production figures (in thousand tonnes) Fertiliser factory: Year 2011…
A:
Q: Use the Women's Earnings scatterplot below to answer the questions. Women's Earnings as a Percentage…
A: From the scatterplot, the linear regression equation is y^=0.617x-1156.3. Estimate the women’s…
Q: The following data show the quarterly sales of a major auto manufacturer for the years I through 3.…
A: “Since you have posted a question with multiple sub-parts, we will solve first three subparts for…
Q: Obtain the straight line trend equation and tabulate against each year trend and short term…
A:
Q: The following are the annual profit in thousands in a.certain business. 2002 2004 2005 2003 75 OF it…
A:
Q: Assuming that trend is absent, determine the seasonality, it any in the data given below Year 1st…
A:
Q: Q3 A manufacturer has plotted product sales over the past four weeks. Use a linear trend line to…
A:
Q: ) In which state have home values increased at a higher rate? Correct b) If these trends were…
A:
Q: You are given the following trend equation Ye 50 + .8X Origin 1982 ; X units one year; Y-units…
A: Answer:
Q: Example 18.15 The trend equation for annual sales of a product is- Y = 102 + 36 X %3D with 1st…
A:
Q: 18. Convert the following annual trend equation on a monthly basis Y= 10.6 + 0.8X+0.64 X
A: To convert an annual trend equation into a monthly trend equation : Y=a+bx+cx2 Divide a by 12, bx…
Q: squares from the data given below and estimate the sales for 1983: Calculate trend values by the…
A:
Q: Below are given the annual production figures (in thousand tonnes) of a fertiliser factory: Year…
A: Solution :-
Q: 1. Laptop sales for Asus Company over the last 7 weeks are shown in the table below. Plot the data,…
A: Use the Excel And Perform the Regression. Followings are the Steps to perform the Regression 1) Open…
Q: Convert the following annual trend equation into a + 4.8 X quarterly one : Yc %3D
A:
Q: The table below is the number of employees owned by Islamic Commercial Banks (BUS) in 2011 – 2020…
A: Regression analysis: Linear Regression analysis is used to measure the association (or) linear…
Q: Question 5 Which best describes the slope of the trendline pictured? Disney+ Subscriptions, REGION 4…
A:
Trending now
This is a popular solution!
Step by step
Solved in 3 steps
- The U.S. Census tracks the percentage of persons 25 years or older who are college graduates. That data forseveral years is given in Table 4[14]. Determine whether the trend appears linear. If so, and assuming the trendcontinues. in what year will the percentage exceed 35%?hudson Marine has been an authorized dealer for c&d marine radios for the past sevenyears. the following table reports the number of radios sold each year.Year 1 2 3 4 5 6 7Number Sold 35 50 75 90 105 110 130a. construct a time series plot. does a linear trend appear to be present?b. Using Minitab or excel, develop a linear trend equation for this time series.c. Use the linear trend equation developed in part (b) to develop a forecast for annualsales in year 8.The following time series shows the sales of supermarket chain over the last six months. Month Sales ($ 000) August 2021 250 Sep 2021 280 Oct 2021 295 Nov 2021 320 Dec 2021 380 Jan 2022 360 Develop a linear trend equation that can be used to forecast sales in Feb 2022. Forecast the sales in Feb 2021 using a three-period weighted moving average designed with the following weights: Nov 2021 weight 0.6, Dec 2021 weight 0.3 and Jan 2022 weight 0.1. Which method (A or B) is the best? Explain why.
- Data collected on the yearly demand for 50-pound bags of fertilizer at Wallace Garden Supply are shown in the following table: YEAR DEMAND FOR FERTILIZER (1,000S OF BAGS) 1 4 2 6 3 4 4 5 5 10 6 8 7 7 8 9 9 12 10 14 11 15 a) Develop a trend line for the demand for fertilizer using any computer software? b) For these three forecasts, 3-year moving average, a weighted moving average, and a trend line, which one would you use? Explain your answer?A supplier of school stationary recorded its quarterly sales figures ($00s) for the years 2009 to 2012. The data is shown in the table below. Year Q1 Q2 Q3 Q4 2009 48 52 16 35 2010 50 46 22 40 2011 68 34 26 35 2012 73 56 3.1 Calculate centred 4- point moving averages (MA) for the data. 3.2 Plot the 4-point MA series on the same graph as the original series. 3.3 Comment on the trend component of the sales.The table given below indicates Small Holding Ltd.’s quarterly profits in 2019 and 2020.Time Period Profit (Thousands Of Rands)2019 Q1 2502019 Q2 2102019 Q3 1652019 Q4 1952020 Q1 2652020 Q2 2182020 Q3 1782020 Q4 204Q.6.3.1 Determine the trend regression function for this data set. In order to obtain full marks for this question, you must complete the relevanttable (template provided below) and then apply the appropriate timeseries formulae in the formulae sheet.Q.6.3.2 Given that the typical seasonal index for Q3 is 87.3, use this informationand the trend regression function obtained in Q.6.3.1 to determine theseasonally adjusted trend estimate for profits in Q3 of 2022.
- The sales records of a major auto manufacturer over the past years from 2005 to 2019 are shown below. Number of Cars Sold Year (In thousands of Units) 2005 195 2006 200 2007 250 2008 270 2009 320 2010 380 2011 440 2012 460 2013 500 2014 500 2015 550 2016 570 2017 600 2018 650 2019 700 Develop moving average with k=4 and compute its MSE Develop exponential model with α = 0.4 and compute its MSE Develop a linear trend model and compute its MSE Based on the MSE computed fore ach model , which model fits well to the data Based on the answer of question (4) forecast the number of cars sold for year 2020.Q13What is the correlation between average monthly rainfall and crop yield in a given region over the past 10 years, and how does this relationship vary across different types of crops grown in the area?An auctioneer of antique Iranian rugs kept records of his weekly auctions in order to determine the relationships among price, age of carpet or rug, number of people attending the auction, and the number of times the winning bidder had previously attended his auctions. He felt that, with this information, he could plan his auctions better, serve his steady customers better, and make a higher overall profit for himself. The results shown in the accompanying table were obtained.
- Amex PLC has gathered following information on the sales of face mask from April 2020 toSeptember 2020.Month Sales ($)April 17,000May 18,000June 19,500July 22,000August 21,000September 23,000You are required to;a. Using linear trend equation forecast the sales of face masks for October 2020.The below data represent the advertising expenditure and sales of Little Liu Ltd from year 2008 to 2017. Table: Advertising Expenditure vs. Sales from 2008 to 2017 Year Advert. Expenditure Sales (x, £000) (y, £000) 2008 8 30 2009 12 40 2010 11 29 2011 5 29 2012 14 43 2013 3 17 2014 6 20 2015 8 30 2016 4 22 2017 9 40 Total 80 300 Figure: Scatter Diagram of Advertising Expenditure and Sales with Trend line Work out the values of parameters of the relationship shown in the Figure (i.e. work out the equation of the relationship).find the linear correlation coefficent and the critical value(s)