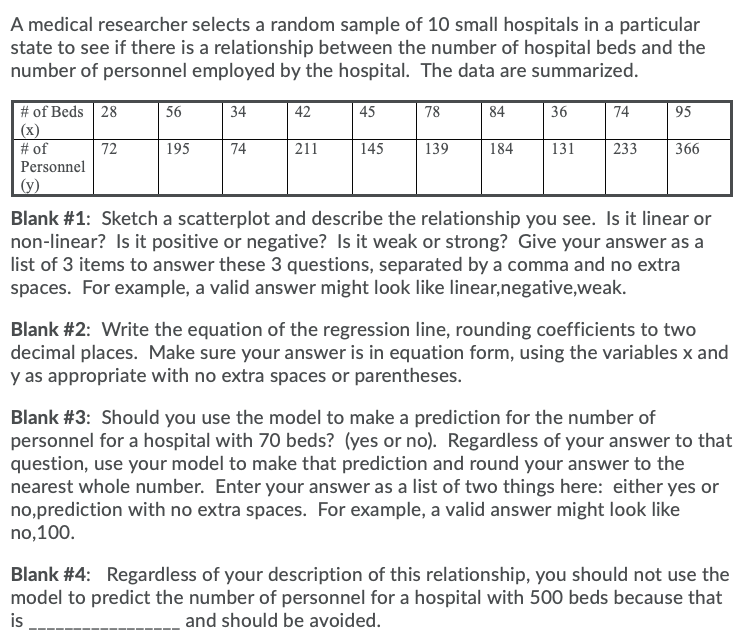
A medical researcher selects a random sample of 10 small hospitals in a particular state to see if there is a relationship between the number of hospital beds and the number of personnel employed by the hospital. The data are summarized. 36 # of Beds 28 (x) # of Personnel 56 34 42 45 78 84 74 95 72 195 74 211 145 139 184 131 233 366 (y) Blank #1: Sketch a scatterplot and describe the relationship you see. Is it linear or non-linear? Is it positive or negative? Is it weak or strong? Give your answer as a list of 3 items to answer these 3 questions, separated by a comma and no extra spaces. For example, a valid answer might look like linear,negative,weak. Blank #2: Write the equation of the regression line, rounding coefficients to two decimal places. Make sure your answer is in equation form, using the variables x and y as appropriate with no extra spaces or parentheses. Blank #3: Should you use the model to make a prediction for the number of personnel for a hospital with 70 beds? (yes or no). Regardless of your answer to that question, use your model to make that prediction and round your answer to the nearest whole number. Enter your answer as a list of two things here: either yes or no,prediction with no extra spaces. For example, a valid answer might look like no,100. Blank #4: Regardless of your description of this relationship, you should not use the model to predict the number of personnel for a hospital with 500 beds because that is _ and should be avoided.


Correlation
Correlation defines a relationship between two independent variables. It tells the degree to which variables move in relation to each other. When two sets of data are related to each other, there is a correlation between them.
Linear Correlation
A correlation is used to determine the relationships between numerical and categorical variables. In other words, it is an indicator of how things are connected to one another. The correlation analysis is the study of how variables are related.
Regression Analysis
Regression analysis is a statistical method in which it estimates the relationship between a dependent variable and one or more independent variable. In simple terms dependent variable is called as outcome variable and independent variable is called as predictors. Regression analysis is one of the methods to find the trends in data. The independent variable used in Regression analysis is named Predictor variable. It offers data of an associated dependent variable regarding a particular outcome.


Trending now
This is a popular solution!

Step by step
Solved in 2 steps with 2 images


