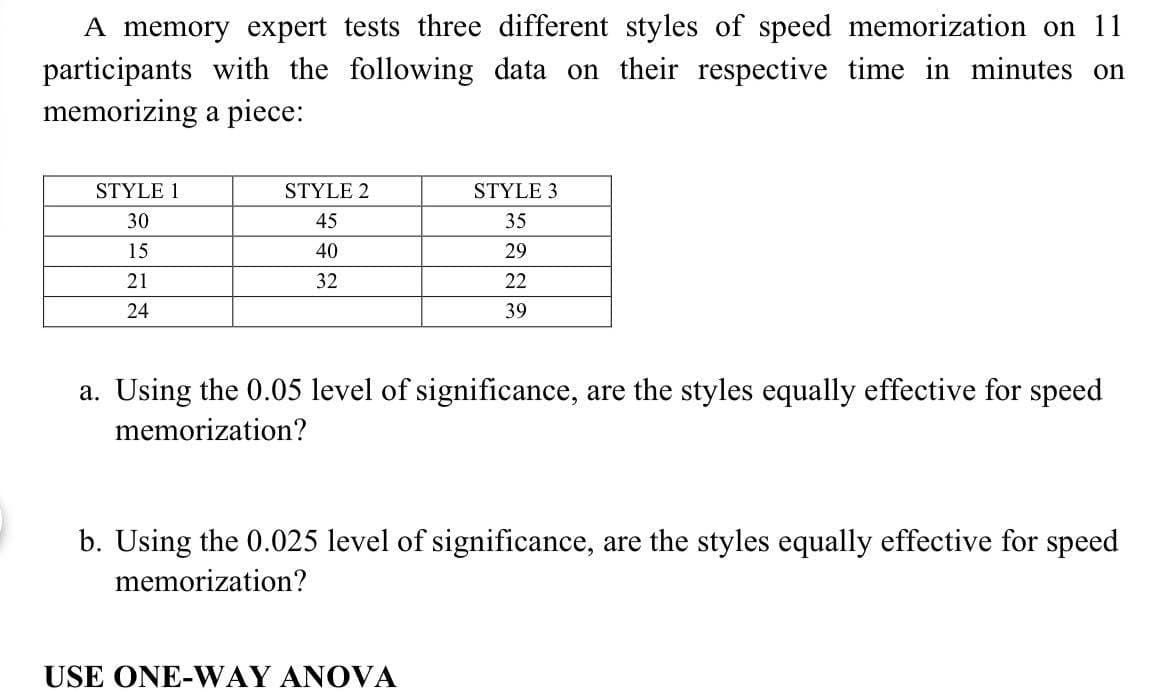
A memory expert tests three different styles of speed memorization on 11 participants with the following data on their respective time in minutes on memorizing a piece: STYLE 1 STYLE 2 STYLE 3 30 45 35 15 40 29 21 32 22 24 39 a. Using the 0.05 level of significance, are the styles equally effective for speed memorization? b. Using the 0.025 level of significance, are the styles equally effective for speed memorization?


Q: A fitness trainer is interested in investigating whether ethnicity and the first exercise activity…
A: ANOVA: The analysis of variance (ANOVA) is used to determine whether there are any statistically…
Q: A memory expert tests three different styles of speed memorization on 11 participants with the…
A:
Q: In a bumper test, three types of autos were deliberately crashed into a barrier at 5 mph, and the…
A: We need to test whether the mean crash damages of the three vehicles are same or not. So, the…
Q: A researcher is interested in investigating whether religious affiliation and the brand of sneakers…
A: Given data, Nike Adidas Other Protestant 75 100 91 Catholic 70 69 96 Jewish 17 16 39…
Q: The Wall Street Journal Corporate Perceptions Study 2011 surveyed readers and asked how each rated…
A: (a) The given data is in the format of a table displaying the frequencies of the variables and the…
Q: The Performance Anxiety Inventory (PAI) was used to measure music performance anxiety on a scale…
A:
Q: A Bloomberg Businessweek subscriber study asked, "In the past 12 months, when traveling for…
A:
Q: 3. In a certain research, some astrologists have speculated that people born under certain sun signs…
A: Given information: Sun Sign Sample Size(N) Extroversion Neuroticism Sample mean SD Sample…
Q: A test of running ability is given to a random sample of 8 runners before and after they completed a…
A: Given that A test of running ability is given to a random sample of 8 runners before and after they…
Q: 1. A memory expert tests three different styles of speed memorization on 11 participants with the…
A: In order to determine whether the three styles are equally effective for speed memorization, a one…
Q: Are our kids getting taller? The average height of kindergartners in 1950 was 39.5 in. The data…
A: From the given information, The average height of kindergartens in 1950 was 39.5. The sample data is…
Q: The success of an airline depends heavily on its ability to provide a pleasant customer experience.…
A: In order to determine whether the population mean minutes late for delayed flights by the two…
Q: A management scientist believes that one way of judging whether a computer came equipped with enough…
A: The following information has been provided: IBM Dell Hewlett-Packard Other 17 8 6 24…
Q: The Wall Street Journal Corporate Perceptions Study 2011 surveyed readers and asked how each rated…
A:
Q: A researcher is interested in investigating whether the military branch a person signs up for and…
A: a. The correct statistical test to use is Independence. b. Null and alternative hypotheses: H0:…
Q: A researcher surveyed randomly selected Democrats and Republicans asking them what the number one…
A: a. The test is check whether there is evidence to conclude that there is difference in what…
Q: strawberry vannila choclate total females 25 18 59 102 males 32 29 37 98 total 57 47 96…
A: The null and alternative hypotheses are H0: There is no relationship between the gender of teenagers…
Q: In a bumper test, three types of autos were dellberately crashed Into a barrler at 5 mph, and the…
A: Hello! As you have posted more than 3 sub parts, we are answering the first 3 sub-parts. In case…
Q: he Wall Street Journal Corporate Perceptions Study 2011 surveyed readers and asked how each rated…
A: Given data is: Quality of Management Reputation of Company Excellent Good Fair Excellent 40…
Q: In a study conducted to investigate browsing activity by shoppers, each shopper was initially…
A: Hello! As you have posted more than 3 sub parts, we are answering the first 3 sub-parts. In case…
Q: In a study of how chief executive officers (CEOs) spend their days, it was found thatCEOs spend an…
A: The data set is: 14 15 18 23 1519 20 13 15 2323 21 15 20 2116 15 18 18 1919 22 23 21 12
Q: An experiment was conducted to examine the performance (as measured by the number of errors made) on…
A: Given information: The data represents the number of errors made on a motor skills task for 2…
Q: Is there an association between hair color and body type? The table below shows the results of a…
A: H0: There is no association between hair color and body type. H1: The is an association between…
Q: here is an archaeological study area located in southwestern New Mexico. Potsherds are broken pieces…
A:
Q: 1. A memory expert tests three different styles of speed memprization on 11 participants with the…
A:
Q: A magazine subscriber study asked, "In the past 12 months, when traveling for business, what type of…
A: It is needed to check whether the type of ticket purchased independent of the type of flight.
Q: A professor at the University of Iowa was interested in evaluating whether domestic dispute calls…
A: Solution: The contengency table Officers Injury Domestic Dispute Not aDomestic Dispute Row…
Q: The Computer Anxiety Rating Scale (CARS) measures an individual's level of computer anxiety, on a…
A: MSB = SSB/dfB = 3172/5 = 634.4 MSW = SSW/dfW = 21246/166 = 127.9880 F = MSB/MSW = 634.4/127.9880 =…
Q: 1. A memory expert tests three different styles of speed memorization on 11 participants with the…
A: The null and alternative are shown below:
Q: Two groups of university students were selected to test the effectiveness of a skills enhancement…
A:
Q: In a bumper test, three types of autos were deliberately crashed into a barrier at 5 mph, and the…
A: Given that In a bumper test, three types of autos were deliberately crashed into a barrier at 5 mph,…
Q: In a study of the effect of mood on the evaluation of nutritious food, 208 subjects were randomly…
A: Given Alpha=0.05 n1=n2=104 S1=2.15 S2=1.75 X1-bar=4.25 X1-bar=5.25
Q: To learn the effectiveness of an exercise regimen, a physical therapist randomly selects 10 women to…
A: The following information has been provided: Sample 1 = Waist Line Before Sample 2 = Waist Line…
Q: A student wants to see if the number of times a book has been checked out of the library in the past…
A: The correlation coefficient: r=cov(x,y)σxσy=∑i=115(x-x¯)(y-y¯)/nσxσy=538.20*53.1=0.1217 The equation…
Q: In a study of the effect of mood on the evaluation of nutritious food, 208 subjects were randomly…
A: Given n1=n2=104 S1=2.15 S2=1.75
Q: Does a statistics course improve a student's mathematics skills, as measured by a national test?…
A: Given: Before After 430 465 485 475 520 535 360 410 440 425 500 505 425 450 470…
Q: In this exercise, we investigate answers to the questions: How much of an effect does your roommate…
A:
Q: Twenty-eight college faculty at Acme Looniversity who volunteered for a fitness program were divided…
A: The given sample size for group 1 is 14, sample mean is 4.6 and sample standard deviation is 0.69.…
Q: A researcher is interested in investigating whether living situation and pet ownership are…
A: a. Chi-square independence test: The chi-square is a non-parametric test which is used for comparing…
Q: n a bumper test, three types of autos were deliberately crashed into a barrier at 5 mph, and the…
A: Given: Goliath Varmint Weasel 1,660 1,290 1,000 770 1,440 2,120 880 1,320 1,850 1,960…
Q: 4-Winning-team data were collected for teams in different sports, with the results given in the…
A:
Q: A food services manager for a baseball park wants to know if there is a relationship between gender…
A: Level of significance: From the given information, Claim: Test whether there is any association…
Q: In a study to determine the effect of early child care on infant-mother attachment patterns, 92…
A: Null hypothesis: Attachment pattern and amount of time spent in child care are independent.…
Q: In a mathematics class, the scores of 10 students in their Mathematics are the following: 4 14 10 8…
A: Given data: Using Linear interpolation: 1) Arrange tha data set in increasing order,. 2) find…
Q: 3. A company institutes conducts an exercise break for its workers to see if this will improve, as…
A:
Q: 2. In an experiment to determine the effect of nutrition on the attention spans of elementary school…
A: We want to test ANOVA Hypothesis Ho: mu1=mu2=mu3 vs H1: at least two are different
Q: The Bem Sex Role Inventory (BSRI) provides independent assessments of masculinity and femininity in…
A: For the sample of 1974 male M = ? df =? s2 = ? s =? For the sample of 1999 male M = ? df =? s2 = ? s…
Q: A Bloomberg Businessweek subscriber study asked, "In the past 12 months, when traveling for…
A: In hypothesis testing we test the hypothesis regarding the population parameter.
Q: In a UK business school, lecturers have tried to determine if the number of hours students attend…
A: The regression equation can be found using the technology. Follow the steps given below to find the…
Q: The Wall Street Journal Corporate Perceptions Study 2011 surveyed readers and asked how each rated…
A: As per honor code we will only answer first question: Null hypothesis: H0: Quality of management is…

Step by step
Solved in 3 steps

- A simple random sample of front-seat occupants involved in car crashes is obtained. Among3000occupants not wearing seat belts,36were killed. Among 7697occupants wearing seat belts,18were killed. Use a0.05significance level to test the claim that seat belts are effective in reducing fatalities. Complete parts (a) through (c) below.In a study examining overweight and obese college football players, Mathews and Wagner(2008) found that on average both offensive and defensive linemen exceeded the at-risk criterionfor body mass index (BMI). BMI is a ratio of body weight to height squared and is commonlyused to classify people as overweight or obese. Any value greater than 30 kg/m2 is considered tobe at risk. In the study, a sample of n = 17 offensive linemen averaged M = 34.4 with a standarddeviation of s = 4.0. A sample of n = 19 defensive linemen averaged M = 31.9 with s = 3.5a. Use a single-sample t test to determine whether the offensive linemen are significantly abovethe at-risk criterion for BMI. Use a one-tailed test with α = .01.b. Use a single-sample t test to determine whether the defensive linemen are significantly abovethe at-risk criterion for BMI. Use a one-tailed test with α = .01.c. Use an independent-measures t test to determine whether there is a significant differencebetween the offensive linemen…A consumer group is investigating a producer of diet meals to examine if its prepackaged meals actually contain the advertised 6 ounces of protein in each package. Based on the following data, is there any evidence that the meals do not contain the advertised amount of protein? Run the appropriate test at a 5% level of
- A recent poll found that 664 out of 1026 randomly selected people in a particular country felt that colleges and universities with big sports programs placed too much emphasis on athletics over academics. Assuming the conditions for the CLT are met, use the accompanying Minitab output to complete parts a and b below. N Event Sample p 95% CI for p 1026 664 0.647173 (0.617934, 0.676413) Question content area bottom b. Suppose a sports blogger wrote an article claiming that a majority of adults from this country believe that colleges and universities with big sports programs place too much emphasis on athletics over academics. Does this confidence interval support the blogger's claim? Explain your reasoning. A. No, it is not a plausible claim because the confidence interval contains 50%. B. No, it is not a plausible claim because the confidence interval does not contain only values above 50%. C. Yes, it is a…Lactation promotes a temporary loss of bone mass to provide adequate amounts of calcium for milk production. The paper “Bone Mass Is Recovered from Lactation to Postweaning in Adolescent Mothers with Low Calcium Intakes” (Amer. J. of Clinical Nutr., 2004: 1322–1326) gave the following data on total body bone mineral content (TBBMC) (g) for a sample both during lactation (L) and in the postweaning period (P). SubjectL 1928 2549 2825 1924 1628 2175 2114 2621 1843 2541P 2126 2885 2895 1942 1750 2184 2164 2626 2006 2627 Does the data suggest that true average total body bone mineral content during postweaning exceeds that during lactation by more than 25 g? State and test the appropriate hypotheses using a significance level of .05.The authors of the article “Predictive Model for PittingCorrosion in Buried Oil and Gas Pipelines”(Corrosion, 2009: 332–342) provided the data on whichtheir investigation was based.a. Consider the following sample of 61 observations onmaximum pitting depth (mm) of pipeline specimensburied in clay loam soil. 0.41 0.41 0.41 0.41 0.43 0.43 0.43 0.48 0.480.58 0.79 0.79 0.81 0.81 0.81 0.91 0.94 0.941.02 1.04 1.04 1.17 1.17 1.17 1.17 1.17 1.171.17 1.19 1.19 1.27 1.40 1.40 1.59 1.59 1.601.68 1.91 1.96 1.96 1.96 2.10 2.21 2.31 2.462.49 2.57 2.74 3.10 3.18 3.30 3.58 3.58 4.154.75 5.33 7.65 7.70 8.13 10.41 13.44Construct a stem-and-leaf display in which the twolargest values are shown in a last row labeled HI.b. Refer back to (a), and create a histogram based oneight classes with 0 as the lower limit of the firstclass and class widths of .5, .5, .5, .5, 1, 2, 5, and 5,respectively.c. The accompanying comparative boxplot fromMinitab shows plots of pitting depth for four differenttypes of soils.…
- When companies are designing a new product, one of the steps typically taken is to see how potential buyers react to a picture or prototype of the proposed product. The product-development team for a notebook computer company has shown picture A to a large sample of potential buyers and picture B to another, asking each person to indicate what they "would expect to pay" for such a product. The data resulting from the two pictures are provided in file (sheet 6). Using the 0.05 level of significance, determine whether the prototypes might not really differ in terms of the price that potential buyers would expect to pay. Sheet 6 ComputerA ComputerB 3 317 2 965 2 680 3 083 3 286 3 137 2 859 2 950 2 693 3 161 2 945 2 918 2 908 3 158 3 193 3 082 3 240 2 903 3 040 3 103…A researcher wanted to determine if carpeted rooms contain more bacteria than uncarpeted rooms. The table shows the results for the number of bacteria per cubic foot for both types of rooms. Full data set Carpeted Uncarpeted 7.5 14.9 9.4 5.1 10.6 4.2 9.2 12.7 9.9 13.3 9.3 4.2 6.9 11.1 7.5 12.5 Determine whether carpeted rooms have more bacteria than uncarpeted rooms at the α=0.05 level of significance. Normal probability plots indicate that the data are approximately normal and boxplots indicate that there are no outliers. State the null and alternative hypotheses. Let population 1 be carpeted rooms and population 2 be uncarpeted rooms. A. H0: μ1=μ2 H1: μ1>μ2 This is the correct answer. B. H0: μ1<μ2 H1: μ1>μ2 C. H0: μ1=μ2 H1: μ1≠μ2 D. H0: μ1=μ2 H1: μ1<μ2 Your answer is not correct. Determine the P-value for this hypothesis test. P-value=nothing…. A new drug for pain relief is being tested within a given palliative care population. The new drug is being compared to an already approved pain relief drug that is commonly used in providing palliative care to patients who experience chronic severe pain. Assume the patients are asked to rate the pain on a scale from 1 to 10, and the data presented below was obtained from a small study designed to compare the effectiveness of the two drugs. Set up and interpret the results of a Mann-Whitney Utest with an alpha of .05. Pain Rating as Reported by Patients Old Drug13346 New Drug12337 Old Drug New Drug Total Sample (Ordered Smallest to Largest) Ranks Old Drug New Drug Old Drug New Drug…
- A new drug for pain relief is being tested within a given palliative care population. The new drug is being compared to an already approved pain relief drug that is commonly used in providing palliative care to patients who experience chronic severe pain. Assume the patients are asked to rate the pain on a scale from 1 to 10, and the data presented below was obtained from a small study designed to compare the effectiveness of the two drugs. Set up and interpret the results of a Mann-Whitney U test with an alpha of .05. Pain Rating as Reported by Patients Old Drug 1 2 2 4 6 New Drug 1 2 2 3 7 Old Drug New Drug Total Sample (Ordered Smallest to Largest) Ranks Old Drug New Drug Old Drug New Drug 1 1 1 1 1.5 1.5 2 2 2 2 4.5 4.5 2 2 2 2 4.5 4.5 4 3 3 7 6 7 4 8 6…A new drug for pain relief is being tested within a given palliative care population. The new drug is being compared to an already approved pain relief drug that is commonly used in providing palliative care to patients who experience chronic severe pain. Assume the patients are asked to rate the pain on a scale from 1 to 10, and the data presented below was obtained from a small study designed to compare the effectiveness of the two drugs. Set up and interpret the results of a Mann-Whitney U test with an alpha of .05. Pain Rating as Reported by Patients Old Drug 1 3 3 4 6 New Drug 1 2 3 3 7A new drug for pain relief is being tested within a given palliative care population. The new drug is being compared to an already approved pain relief drug that is commonly used in providing palliative care to patients who experience chronic severe pain. Assume the patients are asked to rate the pain on a scale from 1 to 10, and the data presented below was obtained from a small study designed to compare the effectiveness of the two drugs. Set up and interpret the results of a Mann-Whitney U test with an alpha of .05. Pain Rating as Reported by PatientsOld Drug 1 2 2 4 6 New Drug 1 2 2 3 7Old Drug New Drug Total Sample(Ordered Smallest to Largest) RanksOld Drug New Drug Old Drug New DrugR1= R2= A) We reject H0 in favor of H1, which states the two populations are not equal at the alpha equals .05 level because the calculated U value of 12.5 is greater than the critical U value of 2.B) We reject H0 in favor of H1, which states the two populations are not equal at the alpha equals .05…


