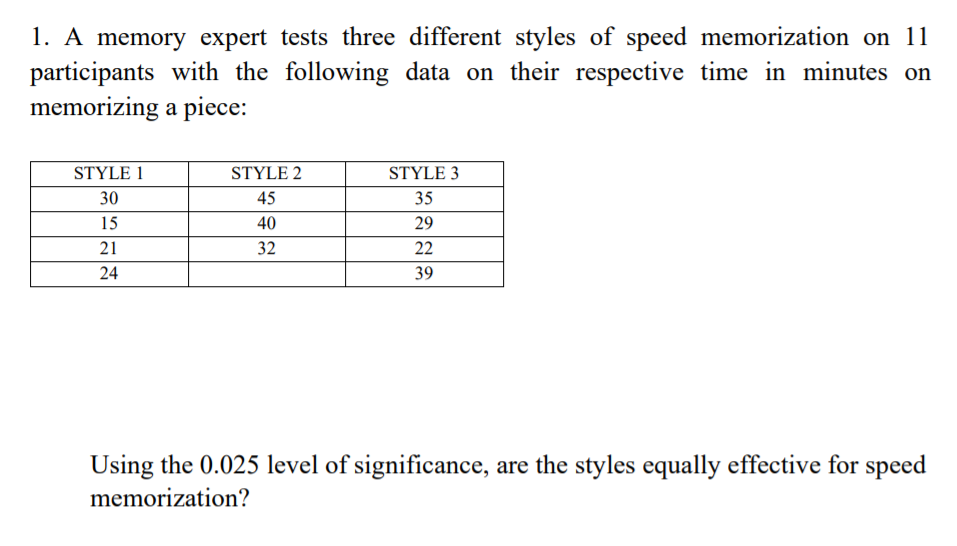
1. A memory expert tests three different styles of speed memorization on 11 participants with the following data on their respective time in minutes on memorizing a piece: STYLE I STYLE 2 STYLE 3 30 45 35 15 40 29 21 32 22 24 39


Q: 5 Age in years of players in a junior basketball league 14 9. 10 11 12 12 11 10 12 13 13 Q = Q, =
A: 5.) 6.)
Q: A problem with a phone line that prevents a customer from receiving or making calls is upsetting to…
A: Claim : The mean waiting time at Central Office I is different with that at Central Office II.
Q: A problem with a phone line that prevents a customer from receiving or making calls is upsetting to…
A: Given that
Q: 4. A company that employs a large number of salespeople is interested in learning which of the…
A:
Q: 2.28 The following data give the number of turnovers (fumbles and interceptions) by a ecollege…
A: The single-value classes means each class has one observation only. The frequency is the number of…
Q: 11.12 A drug company is interested in investigating whether the color of their packaging has any…
A: 11.12 From the given information, the null hypothesis states that the number of packages sold of…
Q: Find the number of math students at a college taking at least one of the languages: French, German,…
A:
Q: To the right is a stem-and-leaf display representing the amount of gasoline purchased, in gallons…
A: see the attachment please........
Q: The table shows the mid-year populations (in millions) of 5 countries in 2010 and the projected…
A:
Q: 1. Determine whether performance in English among selected high school students is related to their…
A: Given E M 17 20 11 15 20 16 3 8 13 10 16 11 4 5 1 4 8 10 9 9 13 10 We…
Q: The following table presents data on the weight of 40 students Berat Badan/Weight (kg) Frekuensi /…
A:
Q: Find the original data from the stemplot. Stem Leaves 7.1 1 8 7.2 8 9 7.3 199
A: Given stem plot,
Q: 16. A botanist wants to see if a new plant grows better in different types of sunlight. He counts…
A: Type of test: One way ANOVA Hypothesis: Ho:μFull sun=μPart. sun=μShade H1:μi≠μj at least one j i.e.…
Q: The number of goals scored per season by two players in a Spanish soccer league from 2009 to 2017…
A: Given that, Player A Player B 2009 34 26 2010 31 40 2011 50 46 2012 46 34…
Q: A company wishes to purchase one of five different machines: A, B, C, D, or E. In an experiment…
A:
Q: It is claimed that a new diet will reduce a person's weight by 4.5 kg, on average, in a period of 2…
A: Given information: Group 1 Group 2 Group 3 Before After Before After Before After 64 59…
Q: Here is a set of data. 2 26 28 90 | 503 | 520 | 522 573 683| 708 773 848 | 968 979 Identify the 5…
A: Solution: The observation in increasing order is 2, 26, 28, 90, 503, 520, 522, 573, 683, 708, 773,…
Q: 4. The ages of Jackson's cousins are shown below. 12, 13, 14, 14, 15, 15, 16, 17, 17, 18, 21 Which…
A: Given data, 12,13,14,14,15,15,16,17,17,18 Here 14,15 and 17 repeats so it is represented as a dot…
Q: A company wishes to purchase one of five different machines: A, B, C, D, or E. In an experiment…
A: Given Research hypothesis: Performance of the machine are equal
Q: The following is the list of the number of hours that 30 people watch TV per week: 3 7 2 16 7 11 34…
A: The given data is: 3,13,10,7,20,4,2,4,26,16,3,13,7,41,6,11,27,23,34,6,4,40,19,29,9,37,30,22,0,5
Q: 2. Compute 10 10 and s for the data set:
A: Consider, S.NO x 1 4/5 2 2/5 3 4/5 4 9/10 5 1/2 6 1/10…
Q: Consider the following data set: 55 33 20 11 25 53 13 50 16 39 39 41 23 23 48 33 11 23 Below is a…
A: Given data set is: 55, 33, 20, 11, 25, 53, 13, 50, 16, 39, 39, 41, 23, 23, 48, 33, 11, 23. We have…
Q: Solve by hand please (no excel). Hypothesis testing will consist of four hypothesis tests which…
A: Given: Pre-test 8, 13, 22, 25, 29, 31, 35, 38, 42, 52 Post-test 31, 37, 45, 28, 50, 37, 49, 25, 36,…
Q: 5 10 11 12 13 14 15 16 17 18 data Based on the boxplot above, identify the 5 number summary D Video…
A: Solution: We have to determine the five number summary for the given boxplot
Q: Consider the following data set for an office structure built by Anderson Construction Co. The…
A: Given in the data, Let FLRCOM is the number of floors completed. Let Hours be the cumulative labor…
Q: he director of a large public library must schedule employees to reshelf books and periodicals…
A:
Q: 11. Consider the following 3 data sets 20 30 40 50 60 -20 -10 10 20 -2 -1 1 ABC
A: Solution
Q: 1. Lyft and Uber drivers around NYC are in a dispute over which route from Hell's Kitchen to the…
A: Solution. To test the hypothesis we will use excel.
Q: 39) Find 22 a. 44 b. 254 C. 628 d. 2309 Ob O a Od Question 40 40) Find the p-value of 2-prop-z-test…
A: Given Information: 16 - 29 years old: Sample size (n1) = 628 Sample proportion (p^1) = 7% = 0.07 30…
Q: DOctor(Military)officeet Lauwyer humen resources 15 Librarians managers 19 23 20 ale 12 23 22 19 30…
A:
Q: d)What is the variance and standard deviation of commute times for these 18 cities? e)Find the z –…
A: We know that Variance= (1/n) (Summation Xi2) - (mean)2 where mean = (1/n) (summation Xi) Standard…
Q: 1. The following data are Mathematics scores of students grouped according to type of high school…
A: The data of mathematics scores of public and private schools are given as: Private Public 79 77…
Q: Suppose a university wishes to compare the effectiveness of four Online, Blended, Course Learning…
A: By applying ANOVA test for a single factor, a) Null and alternative hypothesis: Ho: µ1 = µ2 = µ3…
Q: Interests of students survayed out of 200 80 60 60 45 40 40 30 25 20 IT BUSINESS MATH ENGINEERING…
A: Given: Data from the above graph ; Total number of students = 200 Interested in MATH = 60
Q: Eleven sets of fraternal twins are tracked to see the number of years of education the results are…
A:
Q: The following data represents the age of Covid-19 patients who have been recorded as fatalities by…
A: The data points are: 62, 79, 62, 63, 73, 79, 31, 44, 78, 57, 92, 79, 79, 74, 62, 71, 51, 57, 76…
Q: The Bureau of Labor Statistics reports on a variety of employment statistics. "College Enrollment…
A: To calculate P(CLF|HSD), we will first find out the no. of men with high school degree, and then…
Q: 12. The following table gives the quantity of cement in thousands of tonnes mamuferctured each year…
A:
Q: 1. How many of each of the 3 types of computer component should be taken in a sample of 100…
A:
Q: 2. A doctor studies sets of fraternal twins, where one newborn is a boy, and the other is a girl.…
A: Two sample t test: Two sample t test is used to determine the significance difference between two…
Q: A sales manager collected the following data on annual sales for new customer accounts and the…
A: Given : A sales manager collected the following data on annual sales for new customer accounts and…
Q: 17 18 19 14 15 16 data 10 11 12 13 20 Based on the boxplot above, identify the 5 number summary
A:
Q: The data below represents the number of 50kg bags of maize produced by 100 small scale farmers in…
A: As per guidelines we will solve first question only, please repost other questions for more answers.…
Q: Consider two data sets. Set A: n = 5; x = 10 Set B: n = 50; x = 10 (a) Suppose the number 21 is…
A: Given : a) x¯=ΣxnΣx = 10*5 = 50Now,Adding 21 to the sum New sum : Σxn = 50+21=71Mean = xn¯=71/6 =…
Q: 11. Consider the following 3 data sets A 20 30 40 50 60 B. -20 -10 10 20 C -2 -1 1
A: Solution
Q: The number of goals scored per season by two players in a Spanish soccer league from 2009 to 2017…
A: In this question we will use basic of algebra i.e concept of statistics. We will simply find the…
Q: 5. A psychologist at a private psychiatric hospital was asked to determine whether there was any…
A: “Since you have posted a question with multiple sub-parts, we will solve first three subparts for…
Q: 12 13 14 15 16 data 17 18 19 20 Based on the boxplot above, identify the 5 number summary
A: Given, Min =12 Q1=13 Q2=18 Q3=19 Max =20
Q: 40 73 152 297 320 536 574 617 650 702 781 844 860 961 Identify the 5 number summary (min, Q1,…
A:
Q: 8 10 11 12 13 14 15 16 17 18 19 20 data Based on the boxplot above, identify the 5 number summary…
A: Boxplot: The statistical data is representing in simple way to plot the data based on the five…

Step by step
Solved in 2 steps with 2 images

- A recent poll found that 664 out of 1026 randomly selected people in a particular country felt that colleges and universities with big sports programs placed too much emphasis on athletics over academics. Assuming the conditions for the CLT are met, use the accompanying Minitab output to complete parts a and b below. N Event Sample p 95% CI for p 1026 664 0.647173 (0.617934, 0.676413) Question content area bottom b. Suppose a sports blogger wrote an article claiming that a majority of adults from this country believe that colleges and universities with big sports programs place too much emphasis on athletics over academics. Does this confidence interval support the blogger's claim? Explain your reasoning. A. No, it is not a plausible claim because the confidence interval contains 50%. B. No, it is not a plausible claim because the confidence interval does not contain only values above 50%. C. Yes, it is a…An industrial-organizational psychologist believes that implementing a 2-hour lunch break at US companies will have an effect on employee productivity. On a productivity scale from 1 to 15, the average productivity score for all companies in the US is 8 (u = 8.00, ỡ = 4.00). The IO psychologist randomly samples 5 companies and has the companies implement a 2-hour lunch break for 1 month. At the end of the month, the lO psychologist measures the productivity scores for the five companies and obtains the following scores: 9, 14, 10, 12, 15 Using the appropriate hypothesis test and the six steps of hypothesis testing, determine what the 10 psychologist should conclude about the effect of a 2-hour lunch break on employee productivity. 1) What are the null and alternative hypotheses 2)Construct a sampling distribution of means representing the null hypothesis. Specify the sampling distribution's mean and standard error 3)Using a two-tailed alpha of .05 (a = 05), determine the critical…An industrial-organizational psychologist believes that implementing a 2-hour lunch break at US companies will have an effect on employee productivity. On a productivity scale from 1 to 15, the average productivity score for all companies in the US is 8 (u = 8.00, ỡ = 4.00). The IO psychologist randomly samples 5 companies and has the companies implement a 2-hour lunch break for 1 month. At the end of the month, the lO psychologist measures the productivity scores for the five companies and obtains the following scores: 9, 14, 10, 12, 15 Using the appropriate hypothesis test and the six steps of hypothesis testing, determine what the 10 psychologist should conclude about the effect of a 2-hour lunch break on employee productivity. 1. What is the appropriate test to use ? 2. List the test's assumptions .You do NOT have to test the assumptions. 3. What are the null and alternative hypotheses ? 4. Construct a sampling distribution of means representing the null hypothesis. Specify the…
- An industrial-organizational psychologist believes that implementing a 2-hour lunch break at US companies will have an effect on employee productivity. On a productivity scale from 1 to 15, the average productivity score for all companies in the US is 8 (u = 8.00, ỡ = 4.00). The IO psychologist randomly samples 5 companies and has the companies implement a 2-hour lunch break for 1 month. At the end of the month, the lO psychologist measures the productivity scores for the five companies and obtains the following scores: 9, 14, 10, 12, 15 Using the appropriate hypothesis test and the six steps of hypothesis testing, determine what the 10 psychologist should conclude about the effect of a 2-hour lunch break on employee productivity. 1. What is the appropriate test to use ? 2. List the test's assumptions .You do NOT have to test the assumptions. 3. What are the null and alternative hypotheses ? 4. Construct a sampling distribution of means representing the null hypothesis. Specify the…An industrial-organizational psychologist believes that implementing a 2-hour lunch break at US companies will have an effect on employee productivity. On a productivity scale from 1 to 15, the average productivity score for all companies in the US is 8 (u = 8.00, ỡ = 4.00). The IO psychologist randomly samples 5 companies and has the companies implement a 2-hour lunch break for 1 month. At the end of the month, the lO psychologist measures the productivity scores for the five companies and obtains the following scores: 9, 14, 10, 12, 15 Using the appropriate hypothesis test and the six steps of hypothesis testing, determine what the 10 psychologist should conclude about the effect of a 2-hour lunch break on employee productivity. 1) write out the null and alternative hypotheses 2) Use an online calculator to calculate the exact p-valueAn industrial-organizational psychologist believes that implementing a 2-hour lunch break at US companies will have an effect on employee productivity. On a productivity scale from 1 to 15, the average productivity score for all companies in the US is 8 (u = 8.00, ỡ = 4.00). The IO psychologist randomly samples 5 companies and has the companies implement a 2-hour lunch break for 1 month. At the end of the month, the lO psychologist measures the productivity scores for the five companies and obtains the following scores: 9, 14, 10, 12, 15 1. State whether you reject or fail to reject the null hypothesis 2. Use an online calculator to calculate the exact p-value 3. Calculate and report the effect size 4. Based on the results of your analysis, does a 2-hour lunch break increase, decrease, or have no effect on productivity ?
- A paper investigated the driving behavior of teenagers by observing their vehicles as they left a high school parking lot and then again at a site approximately 1 2 mile from the school. Assume that it is reasonable to regard the teen drivers in this study as representative of the population of teen drivers. Amount by Which Speed Limit Was Exceeded MaleDriver FemaleDriver 1.2 -0.1 1.4 0.4 0.9 1.1 2.1 0.7 0.7 1.1 1.3 1.2 3 0.1 1.3 0.9 0.6 0.5 2.1 0.5 (a) Use a .01 level of significance for any hypothesis tests. Data consistent with summary quantities appearing in the paper are given in the table. The measurements represent the difference between the observed vehicle speed and the posted speed limit (in miles per hour) for a sample of male teenage drivers and a sample of female teenage drivers. (Use μmales − μfemales.Round your test statistic to two decimal places. Round your degrees of freedom down to the nearest whole number. Round your p-value to…A paper investigated the driving behavior of teenagers by observing their vehicles as they left a high school parking lot and then again at a site approximately 1 2 mile from the school. Assume that it is reasonable to regard the teen drivers in this study as representative of the population of teen drivers. Amount by Which Speed Limit Was Exceeded MaleDriver FemaleDriver 1.3 -0.1 1.3 0.4 0.9 1.1 2.1 0.7 0.7 1.1 1.3 1.2 3 0.1 1.3 0.9 0.6 0.5 2.1 0.5 (a) Use a .01 level of significance for any hypothesis tests. Data consistent with summary quantities appearing in the paper are given in the table. The measurements represent the difference between the observed vehicle speed and the posted speed limit (in miles per hour) for a sample of male teenage drivers and a sample of female teenage drivers. (Use μmales − μfemales.Round your test statistic to two decimal places. Round your degrees of freedom down to the nearest whole number. Round your p-value to…The mean ±1 sd of ln [calcium intake (mg)] among 25females, 12 to 14 years of age, below the poverty level is6.56 ± 0.64. Similarly, the mean ± 1 sd of ln [calcium intake(mg)] among 40 females, 12 to 14 years of age, above thepoverty level is 6.80 ± 0.76.*8.7 Suppose an equal number of 12- to 14-year-old girlsbelow and above the poverty level are recruited to studydifferences in calcium intake. How many girls should berecruited to have an 80% chance of detecting a significantdifference using a two-sided test with α = .05?
- The British Department of Transportation studied to see if people avoid driving on Friday the 13th. They did a traffic count on a Friday and then again on a Friday the 13th at the same two locations. The data for each location on the two different dates is in the table. Do the data show that on average fewer people drive on Friday the 13th? Test at the 5% level.Traffic Count Dates 6th 13th 1990, July 137669 135825 1990, July 129699 128891 1991, September 136898 138275 1991, September 138966 139940 1991, December 132021 129640 1991, December 119268 119214 1992, March 131938 131104 1992, March 123306 124760 1992, November 129499 129219 1992, November 138568 135934The number of contaminating particles on a silicon waferprior to a certain rinsing process was determined for eachwafer in a sample of size 100, resulting in the followingfrequencies:Number of particles 0 1 2 3 4 5 6 7Frequency 1 2 3 12 11 15 18 10Number of particles 8 9 10 11 12 13 14Frequency 12 4 5 3 1 2 1a. What proportion of the sampled wafers had at leastone particle? At least five particles?b. What proportion of the sampled wafers had betweenfive and ten particles, inclusive? Strictly between fiveand ten particles?c. Draw a histogram using relative frequency on thevertical axis. How would you describe the shape of thehistogram?A study was conducted in 1997 to measure the total fat content, calories, and sodium content of vegetable burgers available at supermarkets and commonly used as a meat substitute. Measurements on 54 different brands of "veggie burgers," and the results were used to develop the 3-way contingency table below. Under 130 Calories Under 130 Calories 130 Calories or More 130 Calories of More Total Fat Content Under 320 g Sodium 320 g Sodium or More Under 320 g of Sodium 320 g Sodium or More Under 3 g 6 12 1 1 3-4 g 7 4 3 5 Over 4 g 1 1 7 6 A= {"Under 130 Calories"}, B= {"320 g Sodium or More"} C= {"Over 4 g Total Fat"} A vegetable burger is selected randomly from the group. Find the following probabilities: Please Answer D, E, F (d.) P(A and B) (e.) P(A and B and C) (f.) P(A or B)


