
Practical Management Science
6th Edition
ISBN: 9781337406659
Author: WINSTON, Wayne L.
Publisher: Cengage,
expand_more
expand_more
format_list_bulleted
Related questions
Question
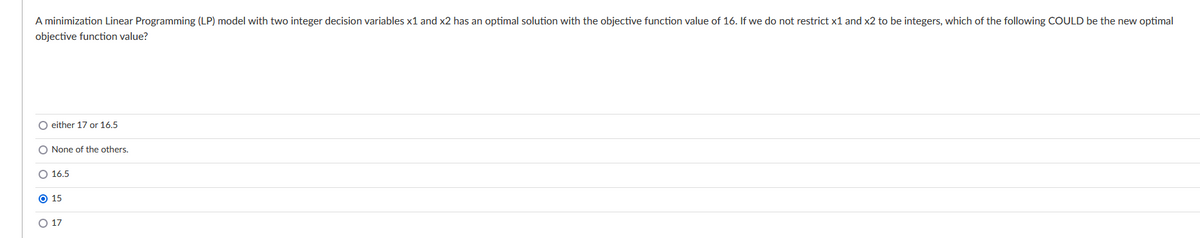

Transcribed Image Text:A minimization Linear Programming (LP) model with two integer decision variables x1 and x2 has an optimal solution with the objective function value of 16. If we do not restrict x1 and x2 to be integers, which of the following COULD be the new optimal
objective function value?
O either 17 or 16.5
O None of the others.
O 16.5
O 15
O 17
Expert Solution
This question has been solved!
Explore an expertly crafted, step-by-step solution for a thorough understanding of key concepts.

This is a popular solution

Trending nowThis is a popular solution!

Step by stepSolved in 3 steps

Knowledge Booster

Similar questions
- In this version of dice blackjack, you toss a single die repeatedly and add up the sum of your dice tosses. Your goal is to come as close as possible to a total of 7 without going over. You may stop at any time. If your total is 8 or more, you lose. If your total is 7 or less, the house then tosses the die repeatedly. The house stops as soon as its total is 4 or more. If the house totals 8 or more, you win. Otherwise, the higher total wins. If there is a tie, the house wins. Consider the following strategies: Keep tossing until your total is 3 or more. Keep tossing until your total is 4 or more. Keep tossing until your total is 5 or more. Keep tossing until your total is 6 or more. Keep tossing until your total is 7 or more. For example, suppose you keep tossing until your total is 4 or more. Here are some examples of how the game might go: You toss a 2 and then a 3 and stop for total of 5. The house tosses a 3 and then a 2. You lose because a tie goes to the house. You toss a 3 and then a 6. You lose. You toss a 6 and stop. The house tosses a 3 and then a 2. You win. You toss a 3 and then a 4 for total of 7. The house tosses a 3 and then a 5. You win. Note that only 4 tosses need to be generated for the house, but more tosses might need to be generated for you, depending on your strategy. Develop a simulation and run it for at least 1000 iterations for each of the strategies listed previously. For each strategy, what are the two values so that you are 95% sure that your probability of winning is between these two values? Which of the five strategies appears to be best?arrow_forwardIn Example 11.1, the possible profits vary from negative to positive for each of the 10 possible bids examined. a. For each of these, use @RISKs RISKTARGET function to find the probability that Millers profit is positive. Do you believe these results should have any bearing on Millers choice of bid? b. Use @RISKs RISKPERCENTILE function to find the 10th percentile for each of these bids. Can you explain why the percentiles have the values you obtain?arrow_forwardYou now have 10,000, all of which is invested in a sports team. Each year there is a 60% chance that the value of the team will increase by 60% and a 40% chance that the value of the team will decrease by 60%. Estimate the mean and median value of your investment after 50 years. Explain the large difference between the estimated mean and median.arrow_forward
- A common decision is whether a company should buy equipment and produce a product in house or outsource production to another company. If sales volume is high enough, then by producing in house, the savings on unit costs will cover the fixed cost of the equipment. Suppose a company must make such a decision for a four-year time horizon, given the following data. Use simulation to estimate the probability that producing in house is better than outsourcing. If the company outsources production, it will have to purchase the product from the manufacturer for 25 per unit. This unit cost will remain constant for the next four years. The company will sell the product for 42 per unit. This price will remain constant for the next four years. If the company produces the product in house, it must buy a 500,000 machine that is depreciated on a straight-line basis over four years, and its cost of production will be 9 per unit. This unit cost will remain constant for the next four years. The demand in year 1 has a worst case of 10,000 units, a most likely case of 14,000 units, and a best case of 16,000 units. The average annual growth in demand for years 2-4 has a worst case of 7%, a most likely case of 15%, and a best case of 20%. Whatever this annual growth is, it will be the same in each of the years. The tax rate is 35%. Cash flows are discounted at 8% per year.arrow_forwardConsider the following card game. The player and dealer each receive a card from a 52-card deck. At the end of the game the player with the highest card wins; a tie goes to the dealer. (You can assume that Aces count 1, Jacks 11, Queens 12, and Kings 13.) After the player receives his card, he keeps the card if it is 7 or higher. If the player does not keep the card, the player and dealer swap cards. Then the dealer keeps his current card (which might be the players original card) if it is 9 or higher. If the dealer does not keep his card, he draws another card. Use simulation with at least 1000 iterations to estimate the probability that the player wins. (Hint: See the file Sampling Without Replacement.xlsx, one of the example files, to see a clever way of simulating cards from a deck so that the Same card is never dealt more than once.)arrow_forwardAssume the demand for a companys drug Wozac during the current year is 50,000, and assume demand will grow at 5% a year. If the company builds a plant that can produce x units of Wozac per year, it will cost 16x. Each unit of Wozac is sold for 3. Each unit of Wozac produced incurs a variable production cost of 0.20. It costs 0.40 per year to operate a unit of capacity. Determine how large a Wozac plant the company should build to maximize its expected profit over the next 10 years.arrow_forward
arrow_back_ios
arrow_forward_ios
Recommended textbooks for you
- Practical Management ScienceOperations ManagementISBN:9781337406659Author:WINSTON, Wayne L.Publisher:Cengage,
Practical Management Science
Operations Management
ISBN:9781337406659
Author:WINSTON, Wayne L.
Publisher:Cengage,