
MATLAB: An Introduction with Applications
6th Edition
ISBN: 9781119256830
Author: Amos Gilat
Publisher: John Wiley & Sons Inc
expand_more
expand_more
format_list_bulleted
Related questions
Concept explainers
Question
thumb_up100%
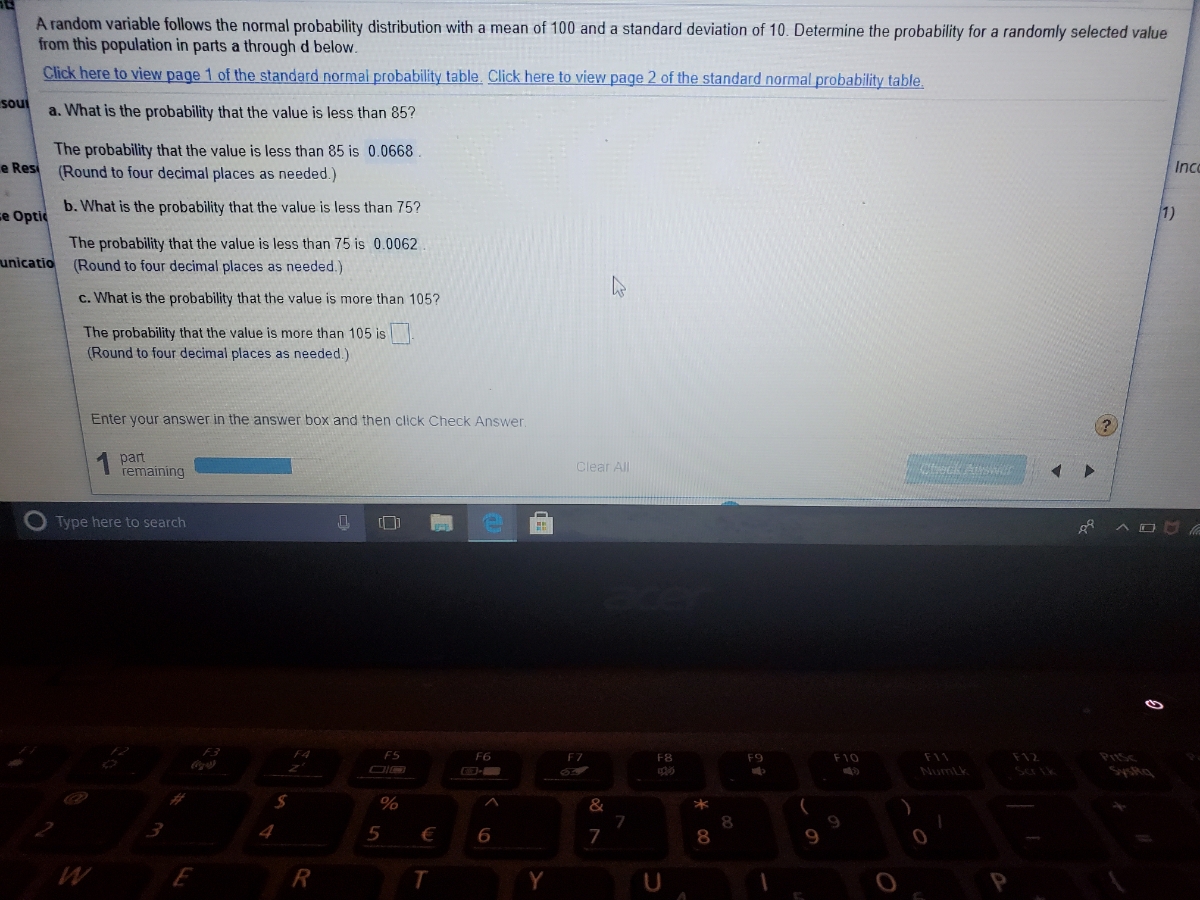

Transcribed Image Text:A random variable follows the normal probability distribution with a mean of 100 and a standard deviation of 10. Determine the probability for a randomly selected value
from this population in parts a through d below.
Click here to view page 1 of the standard normal probability table Click here to view page 2 of the standard normal probability table,
sout
a. What is the probability that the value is less than 85?
The probability that the value is less than 85 is 0.0668.
(Round to four decimal places as needed.)
e Resi
Inco
se Optic
b. What is the probability that the value is less than 75?
1)
The probability that the value is less than 75 is 0.0062
(Round to four decimal places as needed.)
unicatio
c. What is the probability that the value is more than 105?
The probability that the value is more than 105 is
(Round to four decimal places as needed.)
Enter your answer in the answer box and then click Check Answer
part
remaining
Clear All
Type here to search
F3
F4
F5
F6
F11
Numlk
F8
F9
F10
F12
PIUSC
Sa k
&
5
€
7
8.
8
U
Expert Solution
This question has been solved!
Explore an expertly crafted, step-by-step solution for a thorough understanding of key concepts.

This is a popular solution

Trending nowThis is a popular solution!

Step by stepSolved in 2 steps

Knowledge Booster


Learn more about
Need a deep-dive on the concept behind this application? Look no further. Learn more about this topic, statistics and related others by exploring similar questions and additional content below.Similar questions
- Trucks in a delivery fleet travel a mean of 100 miles per day with a standard deviation of 38 miles per day. The mileage per day is distributed normally. Find the probability that a truck drives at least 141 miles in a day. Round your answer to four decimal places.arrow_forwardCollege students are randomly selected and arranged in groups of three. The random variable x is the number in the group who say that they take one or more online courses. Determine whether a probability distribution is given. If a probability distribution is given, find its mean and standard deviation. If a probability distribution is not given, identify the requirements that are not satisfied. Does the table show a probability distribution? Select all that apply. A. Yes, the table shows a probability distribution. B. No, the sum of all the probabilities is not equal to 1. C. No, the random variable x is categorical instead of numerical. D. No, the numerical values of the random variable x are not associated with probabilities. E. No, not every probability is between 0 and 1 inclusive. Find the mean of the random variable x. Select the correct choice below and, if necessary, fill in the answer box to complete your choice. OA. H= students (Round to one decimal place as needed.) O B.…arrow_forward8°F Vindy Question 3 Question submitted. > Next question You can retry this question below The probability distribution for the number of houses on a street is given, but one value is missing. Fill in the missing value, then answer the questions that follow. P(X) X 22 23 24 25 26 ++ 0.16 0.2 0.23 .23 0.18 Round your answers to two decimal places. b) Find the mean number of houses on the street: 27.04 c) Find the variance of the number of houses on the street: 1.79 Submit Question Q Search H 8parrow_forward
- 4.Read and answer please this is a review questionarrow_forwardMean St. Dev. Distribution Males 23.5 in. 1.1 in. Normal Females 22.7 in. 1.0 in. Normal Use the data in the table for sitting adult males and females. These data are used often in the design of different seats, including aircraft seats, train seats, theater seats, and classroom seats. Find the probability that a female has a back-to-knee length between 22.0 in and 24.0 in Warning! This question is not multiple choice! You are to fill in the blank with the correct answer. Write your answer in the form 0.1234arrow_forwardAssume that adults have IQ scores that are normally distributed with a mean of μ=105 and a standard deviation σ=15. Find the probability that a randomly selected adult has an IQ between 90 and 120. Click to view page 1 of the table. LOADING... Click to view page 2 of the table. LOADING... Question content area bottom Part 1 The probability that a randomly selected adult has an IQ between 90 and 120 is enter your response here. (Type an integer or decimal rounded to four decimal places as needed.)arrow_forward
- A random variable follows the normal probability distribution with a mean of 100 and a standard deviation of 10. Determine the probability for a randomly selected value from this population in parts a through d below. Click here to view page 1 of the standard normal probability table. Click here to view page 2 of the standard normal probability table. Question content area bottom Part 1 a. What is the probability that the value is less than 90? The probability that the value is less than 90 is enter your response here. Part 2 b. What is the probability that the value is less than 85? The probability that the value is less than 85 is (Round to four decimal places as needed.) Part 3 c. What is the probability that the value is more than 130? The probability that the value is more than 130 is enter your response here. Part 4 d. What is the probability that the value is more than 75? The probability that the value is more than 75 is (Round to four decimal…arrow_forwardThe figure below represents the data from Table 3.6 in the book. It summarizes the lengths of hospital stays (days) for a sample 25 patients. Duration of hospitalization (days) 6. 1. 01-05 06-10 11-15 16-20 >20 What is the probability that someone stayed in the hospital at most 10 days? None of these choices are correct.arrow_forwardAssume that adults have IQ scores that are normally distributed with a mean of μ=105 and a standard deviation σ=20. Find the probability that a randomly selected adult has an IQ less than 129. Click to view page 1 of the table. LOADING... Click to view page 2 of the table. LOADING... Question content area bottom Part 1 The probability that a randomly selected adult has an IQ less than 129 is enter your response here. (Type an integer or decimal rounded to four decimal places as needed.)arrow_forward
- A customer service center is tracking number of complaints in each week. Let X be the number of complaints in each week. The probability distribution of X is summarized as below. X 0 1 2 3 Probability 0.4 ? 0.15 0.05 Can we be certain that the standard deviation of X is less than 3?arrow_forwardCollege students are randomly selected and arranged in groups of three. The random variable x is the number in the group who say that they take one or more online courses. Determine whether a probability distribution is given. If a probability distribution is given, find its mean and standard deviation. If a probability distribution is not given, identify the requirements that are not satisfied. Does the table show a probability distribution? Select all that apply. A. Yes, the table shows a probability distribution. B. No, the numerical values of the random variable x are not associated with probabilities. C. No, the random variable x is categorical instead of numerical. D. No, the sum of all the probabilities is not equal to 1. E. No, not every probability is between 0 and 1 inclusive. Find the mean of the random variable x. Select the correct choice below and, if necessary, fill in the answer box to complete your choice. O A. μ= students (Round to one decimal place as needed.) OB.…arrow_forwardFind the indicated probability. The age distribution of students at a community college is given below. Number of students Age (years) (f) Under 21 411 21-25 413 26-30 203 31-35 58 Over 35 24 1109 A student from the community college is selected at random. Find the probability that the student is at least 31. Round your answer to three decimal places. O 0.926 82 O 0.052 O 0.074 ASUS 近arrow_forward
arrow_back_ios
SEE MORE QUESTIONS
arrow_forward_ios
Recommended textbooks for you
- MATLAB: An Introduction with ApplicationsStatisticsISBN:9781119256830Author:Amos GilatPublisher:John Wiley & Sons Inc
 Probability and Statistics for Engineering and th...StatisticsISBN:9781305251809Author:Jay L. DevorePublisher:Cengage Learning
 Statistics for The Behavioral Sciences (MindTap C...StatisticsISBN:9781305504912Author:Frederick J Gravetter, Larry B. WallnauPublisher:Cengage Learning
  Elementary Statistics: Picturing the World (7th E...StatisticsISBN:9780134683416Author:Ron Larson, Betsy FarberPublisher:PEARSON
 The Basic Practice of StatisticsStatisticsISBN:9781319042578Author:David S. Moore, William I. Notz, Michael A. FlignerPublisher:W. H. Freeman
 Introduction to the Practice of StatisticsStatisticsISBN:9781319013387Author:David S. Moore, George P. McCabe, Bruce A. CraigPublisher:W. H. Freeman
MATLAB: An Introduction with Applications
Statistics
ISBN:9781119256830
Author:Amos Gilat
Publisher:John Wiley & Sons Inc
Probability and Statistics for Engineering and th...
Statistics
ISBN:9781305251809
Author:Jay L. Devore
Publisher:Cengage Learning
Statistics for The Behavioral Sciences (MindTap C...
Statistics
ISBN:9781305504912
Author:Frederick J Gravetter, Larry B. Wallnau
Publisher:Cengage Learning
Elementary Statistics: Picturing the World (7th E...
Statistics
ISBN:9780134683416
Author:Ron Larson, Betsy Farber
Publisher:PEARSON
The Basic Practice of Statistics
Statistics
ISBN:9781319042578
Author:David S. Moore, William I. Notz, Michael A. Fligner
Publisher:W. H. Freeman
Introduction to the Practice of Statistics
Statistics
ISBN:9781319013387
Author:David S. Moore, George P. McCabe, Bruce A. Craig
Publisher:W. H. Freeman