A research company has designed three different systems to clean up oil spillages. The following table contains the results, measured by how much surface area (in square meters) is cleared in 1 hour. The data were found by testing each method in several trials. Is there any significant difference in the testing of effectiveness of the three systems? Use the 0.05 level of significance. System A System System C 174 165 163 168 161 160 171 172 169 164 157 165 167 170 163
A research company has designed three different systems to clean up oil spillages. The following table contains the results, measured by how much surface area (in square meters) is cleared in 1 hour. The data were found by testing each method in several trials. Is there any significant difference in the testing of effectiveness of the three systems? Use the 0.05 level of significance. System A System System C 174 165 163 168 161 160 171 172 169 164 157 165 167 170 163

MATLAB: An Introduction with Applications
6th Edition
ISBN:9781119256830
Author:Amos Gilat
Publisher:Amos Gilat
Chapter1: Starting With Matlab
Section: Chapter Questions
Problem 1P

Related questions
Question
urgent and important question 2nd
Transcribed Image Text:Q1
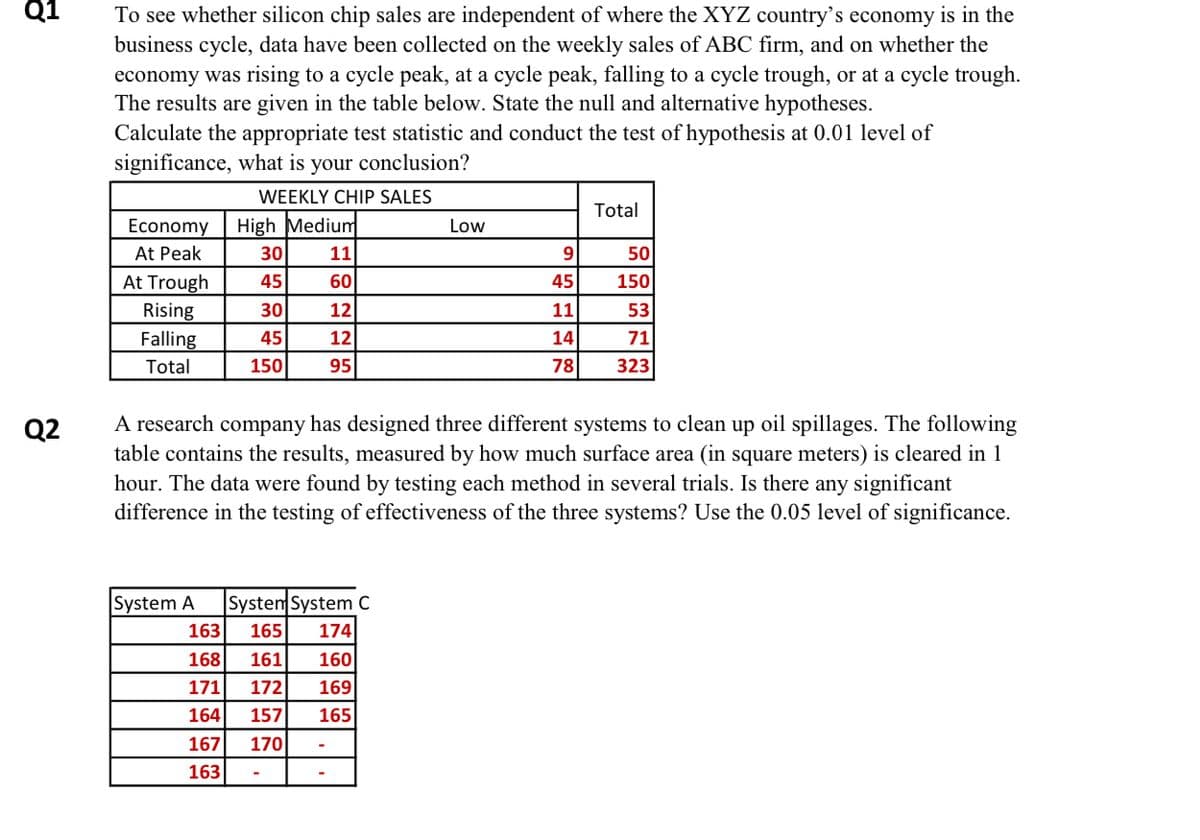
To see whether silicon chip sales are independent of where the XYZ country's economy is in the
business cycle, data have been collected on the weekly sales of ABC firm, and on whether the
economy was rising to a cycle peak, at a cycle peak, falling to a cycle trough, or at a cycle trough.
The results are given in the table below. State the null and alternative hypotheses.
Calculate the appropriate test statistic and conduct the test of hypothesis at 0.01 level of
significance, what is your conclusion?
WEEKLY CHIP SALES
Total
High Medium
Economy
At Peak
Low
30
11
9
50
At Trough
Rising
Falling
45
60
45
150
30
12
11
53
45
12
14
71
Total
150
95
78
323
A research company has designed three different systems to clean up oil spillages. The following
table contains the results, measured by how much surface area (in square meters) is cleared in 1
hour. The data were found by testing each method in several trials. Is there any significant
difference in the testing of effectiveness of the three systems? Use the 0.05 level of significance.
Q2
System A
|System System C
163
165
174
168
161
160
171
172
169
164
157
165
167
170
163
Expert Solution
This question has been solved!
Explore an expertly crafted, step-by-step solution for a thorough understanding of key concepts.

Step by step
Solved in 2 steps with 4 images

Knowledge Booster


Learn more about
Need a deep-dive on the concept behind this application? Look no further. Learn more about this topic, statistics and related others by exploring similar questions and additional content below.Recommended textbooks for you
MATLAB: An Introduction with Applications
Statistics
ISBN:
9781119256830
Author:
Amos Gilat
Publisher:
John Wiley & Sons Inc

Probability and Statistics for Engineering and th…
Statistics
ISBN:
9781305251809
Author:
Jay L. Devore
Publisher:
Cengage Learning

Statistics for The Behavioral Sciences (MindTap C…
Statistics
ISBN:
9781305504912
Author:
Frederick J Gravetter, Larry B. Wallnau
Publisher:
Cengage Learning
MATLAB: An Introduction with Applications
Statistics
ISBN:
9781119256830
Author:
Amos Gilat
Publisher:
John Wiley & Sons Inc
Probability and Statistics for Engineering and th…
Statistics
ISBN:
9781305251809
Author:
Jay L. Devore
Publisher:
Cengage Learning
Statistics for The Behavioral Sciences (MindTap C…
Statistics
ISBN:
9781305504912
Author:
Frederick J Gravetter, Larry B. Wallnau
Publisher:
Cengage Learning

Elementary Statistics: Picturing the World (7th E…
Statistics
ISBN:
9780134683416
Author:
Ron Larson, Betsy Farber
Publisher:
PEARSON

The Basic Practice of Statistics
Statistics
ISBN:
9781319042578
Author:
David S. Moore, William I. Notz, Michael A. Fligner
Publisher:
W. H. Freeman

Introduction to the Practice of Statistics
Statistics
ISBN:
9781319013387
Author:
David S. Moore, George P. McCabe, Bruce A. Craig
Publisher:
W. H. Freeman