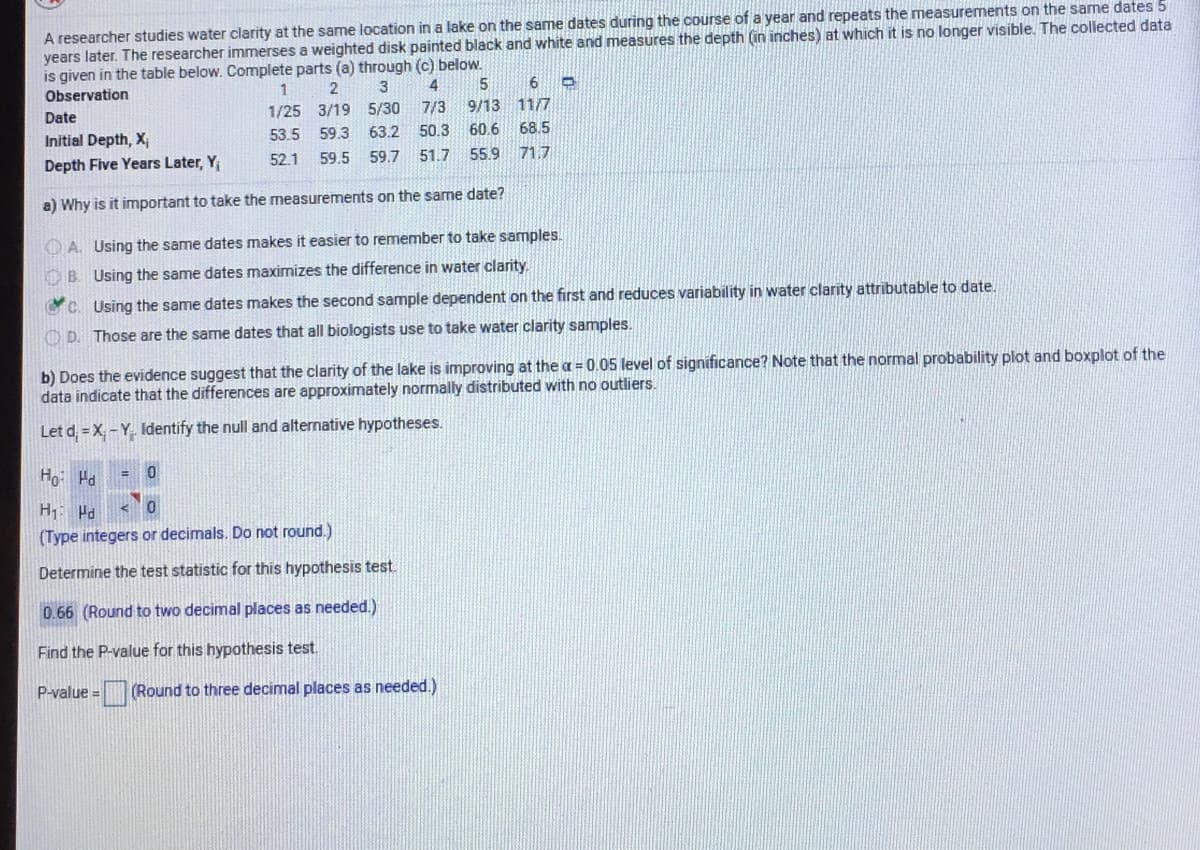
A researcher studies water clarity at the same location in a lake on the same dates during the course of a year and repeats the measurelme years later. The researcher immerses a weighted disk painted black and white and measures the depth (in inches) at which it is no longer visible. The collected data is given in the table below. Complete parts (a) through (c) below. Observation 1 Date 1/25 3/19 5/30 7/3 9/13 11/7 Initial Depth, X 53.5 59.3 63.2 50.3 60.6 68.5 Depth Five Years Later, Y 52.1 59.5 59.7 51.7 55.9 71.7 a) Why is it important to take the measurements on the same date? O A. Using the same dates makes it easier to remember to take samples. OB Using the same dates maximizes the difference in water clarity. GrC. Using the same dates makes the second sample dependent on the first and reduces variability in water clarity attributable to date. O D. Those are the same dates that all biologists use to take water clarity samples. b) Does the evidence suggest that the clarity of the lake is improving at the a = 0.05 level of significance? Note that the normal probability plot and boxplot of the data indicate that the differences are approximately normally distributed with no outliers. Let d, = X - Y Identify the null and alternative hypotheses. Ho: Ha %3! H Hd (Type integers or decimals. Do not round.) Determine the test statistic for this hypothesis test. 0.66 (Round to two decimal places as needed.) Find the P-value for this hypothesis test. P-value = (Round to three decimal places as needed.)


Unitary Method
The word “unitary” comes from the word “unit”, which means a single and complete entity. In this method, we find the value of a unit product from the given number of products, and then we solve for the other number of products.
Speed, Time, and Distance
Imagine you and 3 of your friends are planning to go to the playground at 6 in the evening. Your house is one mile away from the playground and one of your friends named Jim must start at 5 pm to reach the playground by walk. The other two friends are 3 miles away.
Profit and Loss
The amount earned or lost on the sale of one or more items is referred to as the profit or loss on that item.
Units and Measurements
Measurements and comparisons are the foundation of science and engineering. We, therefore, need rules that tell us how things are measured and compared. For these measurements and comparisons, we perform certain experiments, and we will need the experiments to set up the devices.


Trending now
This is a popular solution!

Step by step
Solved in 2 steps with 2 images


