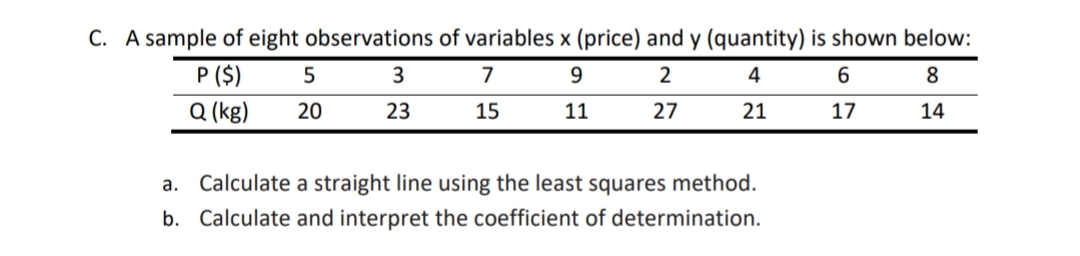
A sample of eight observations of variables x (price) and y (quantity) is shown below: P ($) 5 3 7 9. 2 4 8. Q (kg) 20 23 15 11 27 21 17 14 a. Calculate a straight line using the least squares method. b. Calculate and interpret the coefficient of determination.


Q: The following data give the experience (in years) and monthly salaries (in hundreds of pesos) of…
A: Regression Equation: When we want to predict the value of one variable, say Y, from the given value…
Q: Use least-squares regression to fit a straight line to Along with the slope and intercept, compute…
A: Given data for the X and Y variables : X Y 0 5 2 6 4 7 6 6 9 9 11 8 12 7 15 10…
Q: Complete parts (a) through (c) below for the accompanying data set 4 6 7 y 4 7 8 10 (a) Determine…
A: From the given information, x y x^2 y^2 xy 4 3 16 9 12 5 4 25 16 20 6 7 36 49 42 7 8 49…
Q: U.S. Census Bureau estimates of the average number of persons per household in the United States for…
A: “Since you have posted a question with multiple sub-parts, we will solve first three sub-parts for…
Q: Given are five observations for two variables, x and y. 2 14 17 19 50 58 48 19 14 Yi The estimated…
A: The estimated regression equation for the given data is y^=63.29-2.24x.
Q: A semiconductor industry would like to find out whether worker hours are related to lot sizes. They…
A: Note: since you have posted questions with multiple subparts we will solve the first three questions…
Q: The following summary statistics resulted from a study of the relationship between the cost of a…
A: Solution: The following summary statistics resulted from a study of the relationship between the…
Q: Given the data x 0 3 6 y 1 4 5 Find the best least squares fit by a linear function.
A:
Q: Consider the following data. Do heavier cars really use more gasoline? Suppose a car is chosen at…
A: REGRESSION
Q: The data below represent the number of days absent, x, and the final grade, y, for a sample of…
A: (b) Interpret the slope. The slope is interpreted below as follows: Let X denotes the number of…
Q: 7. The age x in months and vocabulary y were measured for six children, with the results shown in…
A: The provided information is x y xy x2 20 72 1440 400 23 71 1633 529 30 73 2190 900 37 74…
Q: he following data is given: 1 3 4 6. 9 12 14 y 4 5 6. 7 9. 11 se linear least-squares regression to…
A: make a table as follows x y x-x y-y x-x2 x-xy-y 1 2 -6 -4.2857 36 25.7143 3 4 -4 -2.2857 16…
Q: ALL QUESTIOONS ARE COMPULSORY I 1. Y 35.5 14 21 16 22 26.6 35 57.5 40.3 48 18 29 40 54 20.2 23 32…
A: The independent variables which are X1 and X2. The dependent variable is Y. We have to find the…
Q: The data below represent commute times (in minutes) and scores on a well-being survey. Complete…
A: Solution : Given : X : Commute time in minutes Y : Well-Being index score X 5 15 25…
Q: Use five decimal places Fit the following data by the equation y = axb using the Least squares…
A: Consider the exponential equation y=axb. Taking logarithm on both sides of this equation results in…
Q: study was conducted to detemine whether a the final grade of a student in an introductory psychology…
A:
Q: The following table shows the percent of water and the number of calories in various canned soups to…
A: Given Data: Percent Water in Soups: % Water Calories 83.3 28 92.3 26 91.9 39 89.4 57…
Q: An engineer wants to determine how the weight of a car, x, affects gas mileage, y. The following…
A: a) Enter the data in excel as shown below
Q: Use five decimal places Fit the following data by the equation y=(a*x)/(b+x) using the Least…
A: Given: The given equation is y=axb+x x 2 4 10 13 y 15 32 40 24
Q: À. Force (F) versus Mass (M) Force (newtons, N) Mass (grams, g) 100 5 12 16 200 300 20 400 24 500 29…
A: Force(newtons, N)/ x Mass(grams, g)/ y x2 xy 5 100 25 500 12 200 144 2400 16 300…
Q: Use least-squares regression to fit a straight line to 29 21 29 14 21 15 7 7 13 0 3 7 11 15 17 21 23…
A:
Q: Given the bivariate data: 4 5 6. 7 y 2 3 3 5 5 a. Draw a scatter diagram for the data. b. Find n,…
A: Since we only answer up to 3 subparts, we'll answer the first 3. Please resubmit the question and…
Q: Fit a least squares quadratic curve to the following data and estimate Y at X = 2.4 1 2 3 4 Y 1.7…
A:
Q: Find the slope m for the least-squares regression line. x y 7 15 10 16 15 25 18 32
A:
Q: Consider the data points (1, 0), (2, 1), and (3, 5). Compute the least squares error for the given…
A: GivenPoints (1,0) , (2,1) , (3,5) and line y = -2+2ny = -2 +2ny-2x+2 = 0
Q: Fit a straight line by the method of least squares for the data relating to the Indian population…
A: The straight line form is Y = mx + c . This straight line equation can be used for forecasting (or)…
Q: The x values in the accompanying table below represent the number of petrol pumps operated by seven…
A: “Since you have posted a question with multiple sub-parts, we will solve first three subparts for…
Q: Use least-squares regression to fit a straight line to х 6. 7 11 15 17 21 23 29 29 37 39 y 29 21 29…
A:
Q: Given are five observations for two variables, x and y. 5 9 11 15 20 50 52 47 14 13 The estimated…
A:
Q: 21 Fit a straight line by the method of least squares for the data relating to the Indian population…
A:
Q: Given are five observations for two variables, x and y. 1 3 12 15 17 Yi 54 51 43 25 12 The estimated…
A:
Q: Using the method of Least Squares, determine to 4-decimal place the necessary values of the…
A:
Q: The following data represent a company’s yearly sales volume and its advertising expenditure over a…
A: Part 1: The scatter diagram of sales versus advertising and is as given below: The above scatter…
Q: Consider the data points (1, 0), (2, 1), and (3, 5). Compute the least squares error for the given…
A:
Q: 1 2 3 4 5 y 0 1 4 7 9 t
A:
Q: Given are five observations for two variables, a and y. 2 8 13 17 20 51 60 46 16 10 The estimated…
A: Solution-: Given data: X Y 2 51 8 60 13 46 17 16 20 10 Given the estimated…
Q: (c) Find x, and y. Then find the equation of the least-squares line = a + bx. (Round your answers…
A: (c) The mean of x is, x¯=∑ixn=10+12+14+16+18+206=15 Thus, the mean of x is 15. The mean of y is,…
Q: 2. Given the following datalist of the height and weight pairs: Height 68 69 70 70 71 71 72 72 73 73…
A: According to our policy we can answer only first three part for remaining please repost the…
Q: For the bivariate data set 2 3 6 3 1 2 y Calculate the least squares estimates and find the least…
A: The linear regression technique uses a dataset to determine a linear equation, y=ax+b such that the…
Q: Square Footage, X Asking Price ($000s), y 1148 154 1096 159.9 1142 169 1288 169.9 1322 170 1466…
A: Let x = square footage y = price Calculation of regression line: From the table,
Q: sing games won as the explanatory variable x, do the following: The equation of the least squares…
A:
Q: The data below represent commute times (in minutes) and scores on a well-being survey. Complete…
A: The fitted linear model is given as y^=-0.090x+69.045 The value of y^ can be considered as the…
Q: Complete Table 3 and find the values of A and B for the straight line that provides the best…
A: From the given information, The provided data can be shown in the below table; x y 1 2 2 3…
Q: A different study of sales ( y ) with respect to a = advertising expenditure in a given retail…
A:
Q: The following is from a statistical analysis using least-squares regression: 2,662.81 15.95…
A: Regression: simple linear Regression analysis is used to measure the association (or) linear…
Q: The following data represent a company’s yearly sales volume and its advertising expenditure over a…
A: 1. In this case Advertising (x) the independent variable and Sales (y) is the dependent variable.…
Q: Use the least squares method to find the slope of the line of best fit for the data set below. Round…
A: X Y X2 Y2 XY 67 46 4489 2116 3082 28 34 784 1156 952 26 33 676 1089 858 47 38 2209 1444 1786…
Q: A study was conducted to detemine whether a the final grade of a student in an introductory…
A: For the given data estimate x =100 y =?
Q: 9) We have a sample of 6 observations on exam scores and hours of study and would like to estimate…
A: Here, we have a regression equation: Score = b0 + b1* hours + e Here, score of the exam is the…
Q: Given are five observations for two variables, x and y. 4 9 12 14 20 50 52 40 22 10 The estimated…
A: (a) Use EXCEL to determine the values of SSE, SST and SSR EXCEL procedure: Go to EXCEL Go to…

Step by step
Solved in 2 steps with 3 images


- In order to study the relationship between age and length of time that a smoker has been smoking, the following data were collected. x= age of a smoker y= years since he or she started smoking. x = y= 26 8 32 9 27 7 24 6 34 10 20 4 Compute the coorelation and find the least squares line.Given are five observations for two variables, x and y. xi 3 8 12 18 20 yi 54 57 50 24 11 -select your answer choices- b. The least squares line provided an (good, bad) fit; __ % of the variability in y has been explained by the estimated regression equation (to 1 decimal)Compute the sum-of-squares error (SSE) by hand for the given set of data and linear model. (6, 6), (7, 7), (9, 10); y = x − 1
- The following data represent a company’s yearly sales volume and its advertising expenditure over a period of 5 years. (Y) (X) Sales in Millions Advertising Of Dollars in ($10,000) 15 32 16 33 18 35 17 34 16 36 Develop a scatter diagram of sales versus advertising and explain what it shows regarding the relationship between sales and advertising. Use the method of least squares to compute an estimated regression line between sales and advertising by computing b0 and b1The following data represent the number of flash drives sold per day at a local computer shop andtheir prices.Price (x) Units Sold (y)$34 336 432 635 530 938 240 1 a. Develop a least squares regression line and explain what the slope of the line indicates.b. Compute the coefficient of determination and comment on the strength of relationship betweenx and y.In the manufacture of synthetic fiber, the fiber is often “set” by subjecting it to high temperatures. The object is to improve the shrinkage properties of the fiber. In a test of 23 yarn specimens, the relationship between temperature in °C (x) and shrinkage in % (y) was summarized by the least-squares line y = −12.789 + 0.133x. The total sum of square was ∑ni=1(yi−y⎯⎯)2∑i=1n(yi−y¯)2 = 57.313, and the estimated error variance was s2 = 0.0670. Compute the coefficient of determination r 2. Round the answer to three decimal places.
- ou are given the following information about x and y. X Independent Variable Y Dependent Variable 15 5 12 7 10 9 7 11 The least squares estimate of b1 equals [3 decimals] ___________ The least squares estimate of b0equals _______________ The sample correlation coefficient equals _________A regression analysis between sales (y in $1000) and advertising (x in $100) resulted in the following least-squares line: yˆ ? 85 ? 7x. Given this information, if advertising costs were $600, what could we reasonably expect the amount of sales (in dollars) to be?The maximum discount value of the Entertainment® card for the “Fine Dining”section, Edition 10, for various pages is given below. Page number Maximum value ($)4 1614 1925 1532 1743 1957 1572 1685 1590 17What is the slope of the least squares (best-fit) line? Interpret the slope. What is the intercept of the least squares (best-fit) line? Interpret theintercept.
- The following table gives retail values of a 2017 Corvette for various odometer readings. Odometer Reading Retail Value ($) 13,000 52,525 18,000 51,675 20,000 51,400 25,000 50,475 29,000 49,825 32,000 49,275 (a) Find the equation of the least-squares line for the data. (Where odometer reading is the independent variable, x, and retail value is the dependent variable. Round your numerical values to two decimal places.) ŷ = (b) Use the equation from part (a) to predict the retail price of a 2017 Corvette with an odometer reading of 30,000. Round to the nearest $100. $ (c) Find the linear correlation coefficient for these data. (Round your answer to four decimal places.) r =The following table shows how many weeks a sample of 6 persons have worked at an automobile inspection station and on any given day: a) Find the least squares estimators and the values for a and b ??? = ___________ ? = ___________ ??? = ___________ ? = ___________ ??? = ___________ b) Determine AND WRITE the equation for the best fit line. c) Find the correlation coefficient, r, and describe the relationship between weeks in the program and time improvement.A study was conducted to detemine whether a the final grade of a student in an introductory psychology course is linearly related to his or her performance on the verbal ability test administered before college entrance. The verbal scores and final grades for 10 students are shown in the table below. Student Verbal Score x Final Grade y 1 30 39 2 58 69 3 57 70 4 35 42 5 69 83 6 75 93 7 51 62 8 56 63 9 25 27 10 50 63 Find the least squares line. y^= + x Should the regression be used to predict the final grade of a student with a verbal score of 100? answer:
