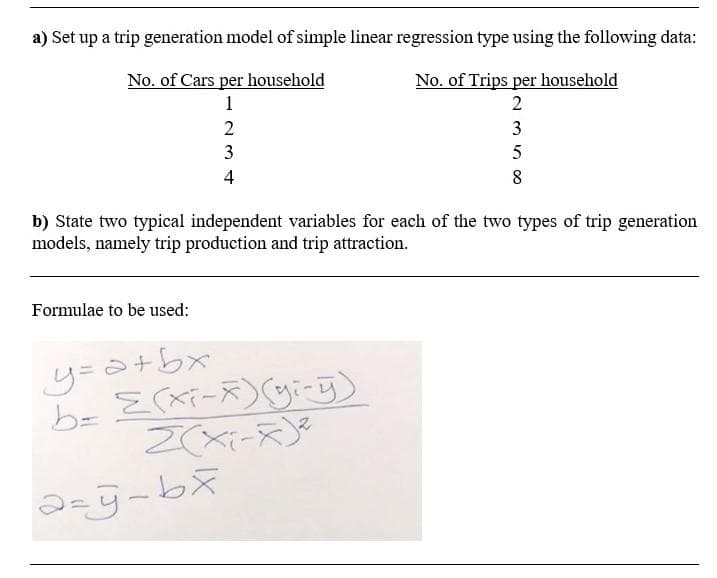
a) Set up a trip generation model of simple linear regression type using the following data: No. of Cars per household No. of Trips per household 1 2 2 3 3 5 4 8 b) State two typical independent variables for each of the two types of trip generation models, namely trip production and trip attraction. Formulae to be used: y=ö+bx b= 2(x-)(切)


Q: We wish to predict the salary for baseball players (yy) using the variables RBI (x1x1) and HR…
A: (a) Use EXCEL to obtain the regression equation. EXCEL procedure: Go to EXCEL Go to…
Q: The figures for Triple A's revenue and the amount of money earned by wage earners in Albany - NY has…
A: The given data is, X Y 3 6.5 4 8.0 5 8.5 6 5.5 2 4.0 5 9.0 So,
Q: The following constants are obtained from measurements on length in mm. (X1), volume in c.c. (X2)…
A:
Q: 2. Consider the following data for two variables, x and y. 32 18 15 26 у 10 20 21 16 22 a. Develop…
A: Regression analysis is used to study the relationship between two or more variables. Moreover, the…
Q: 1. The relationship between energy consumption and household income was studied, yielding the…
A: The independent variable is Household income. The dependent variable is Energy consumption. We have…
Q: associated with a particular manufactuning volume. Consider tne following sample of production…
A: Solution
Q: Construct the equation of the regression line. The following table lists the age of a cow (in years)…
A: The regression equation is, y⏞ = b*X +a Where, b =Σ(x-x)*(y-y)Σ(x-x)2a= y¯-b*x
Q: Given are five observations for two variables, x and y. xi 1 2 3 4 5 yi 4 7 4 11 14 Develop…
A: Given are five observations for two variables, x and y. xi 1 2 3 4 5 yi 4 7 4 11 14
Q: Which of the following is a multiple linear regression model? O Y= Bo+B1x + B2x² OY =Bo+B1x O…
A: Let us determine which one of the above is a multiple linear regression model in the next step.
Q: A study is conducted to determine if there is a relationship between the two variables, blood…
A: Regression equation is used to relate the dependent variable with one or more independent variable.…
Q: Consider the following data and create a linear regression model: Data 1 2 3 6 Y 6 6 11 12 O…
A:
Q: Find the equation of the regression line for the given data. -5 -3 4 -1 -2 3 11 -6 3 -4 -5 8. =…
A: The regression equation for one independent variable is, From the given information, Let X…
Q: An engineer measures a dependent variable y and independent variables x1, x2,and x3. MINITAB output…
A: From the given regression output, the p-values of x1 and x3 are greater than 0.05. Hence, these two…
Q: Demand for oil changes at Garcia's Garage has been as follows:…
A: Introduction: We have obtained the regression equation using Excel. First, we have entered the data…
Q: For a simple linear regression model, a 100(1 - a)% prediction interval for a new value of Y when X…
A:
Q: In a study of pollution in a water stream, the concentration of pollution is mea- sured at 5…
A:
Q: 23: The accountant of Manama Corporation has collected the following data on its copy machine costs…
A: a) Plotting the points on graph from given data: From the given data the line of best fit is:…
Q: An analyst fits the following regression model using 1,000 sample data: Profit = 30.23 + 20.62…
A: From the given information, the fitted regression line is, Profit = 30.23 + 20.62 Service Quality +…
Q: 6) Consider the following problem. Student Test Score IQ Gender 1 93 125 Male 2 86 120 Female 3 96…
A: Given: y x1 x2 93 125 Male 86 120 Female 96 115 Male 81 110 Female 92 105 Male 75…
Q: The following list shows the number of people (in millions) in the United States whose only means of…
A: Given that, For year 1940 Number of people is 7.6 million. i.e y=7.6
Q: A shoe store developed the following estimated regression equation relating sales to inventory…
A:
Q: Given are five observations for two variables, x and y. xi -3 12 6 20 14 yi -55 40 55 10 15 Develop…
A: Given that
Q: A professor in a university polled a dozen colleagues about the number of professional meetings they…
A: The independent variable is the number of professional meetings they attended in the past five…
Q: Given are five observations for two variables, x and y. xi 1 2 3 4 5 yi 4 6 6 11 13 Develop the…
A: Given: n=5 The formulas of b0 and…
Q: We wish to predict the salary for baseball players (yy) using the variables RBI (x1x1) and HR…
A: a) The multiple linear regression equation can be formed using excel as follows: Step 1: Put the…
Q: ) ii and iii only
A: Dependent variables - A variable whose value depends on another variable . Independent variables - A…
Q: 2.state each of the five assumptions of the classical regression model (OLS) and give an intuitive…
A: A linear regression model is a statistical technique that is used to predict the interested variable…
Q: 1. In the study of linear regression analysis, distinguish between the following expressions: (a)…
A: Note: Hey, since multiple questions are posted, we will answer first three question for you. If you…
Q: The table below shows the number of state-registered automatic weapons and the murder rate for…
A: Given , x = thousands of automatic weapons y = Murders per 100,000 Given regression equation , y…
Q: A shoe store developed the following estimated regression equation relating sales to inventory…
A: Given : Total independent variables = 2 Degrees of freedom of regression = dfregression = 2 Total…
Q: Given the two regression lines x+2y-5 0, 3y + 2x-8=0, the means of x and y are 2,2 O 2.5, 1.5 O 5,4…
A: Given, Two regression lines x+2y-5=0 3y+2x-8=0
Q: The following data are the average annual repair cost (in O.R.) and the age of automobiles ( in…
A: In this case car age (x) the independent variable and repair cost (y) is the dependent variable.
Q: The table below shows the number of state-registered automatic weapons and the murder rate for…
A: From given data, X Y X*Y X*X 11.3 13.9 157.07 127.69 8.2 10.7 87.74 67.24 7.1 10.3 73.13…
Q: 4.5 Consider the multiple regression model fit to the house price data. URIA SEIS FUR EXERULISES JUI…
A: Given Information: Consider the given dataset: y x1 x2 x3 x4 x5 x6 x7 x8 x9 25.9 4.9176 1.00…
Q: 13. Table 1 lists enrollment in US degree-granting instutions for both undergraduate and graduate…
A: We need to solve scatter plot problem.
Q: A professor in the School of Business in a university polled a dozen colleagues about the number of…
A:
Q: Midgett Co. has accumulated data to use in preparing its annual profit plan for the upcoming year.…
A: The percentage of the total variance that can be explained by the regression equation is given by…
Q: The following data are the average annual repair cost (in O.R.) and the age of automobiles ( in…
A: From the provided information, The regression equation can be obtained using excel steps as follow:…
Q: Given are five observations for two variables, x and y. xi 3 12 6 20 14 yi 55 45 50 15 20 #1)…
A:
Q: b) Consider the data showing observations on the quantity demanded of a certain commodity depending…
A: The dependent variable is Quantity demanded. The independent variables are Price and Income. We have…
Q: a) Compute the linear regression line y=bo+b₁x b) What is the estimated value, y for x = 7?
A: Given: Number of pairs of observations, n=9 X Y 1 16 2 23 3 35 4 28 5 44 6 40 7 22…
Q: To fit a simple linear regression model to the data and to provide its equation (d = a*t + b), along…
A: To fit a simple linear regression line we first define the independent and the dependent variables.…
Q: The table below shows the number of state-registered automatic weapons and the murder rate for…
A: Given: X = thousands of automatic weaponsY = murders per 100,000 residents The equation of linear…
Q: The table contains data on vehicle speed (h) and fuel consumption (lt / 100km) of 5 randomly…
A: Let, x= speed and y= Consumption first we have to find regression equation for predicting the…
Q: Which of the following is NOT necessarily true about the interpretation of the value of b in the…
A: The regression equation is in the form of straight line y = a + bx where y =…
Q: Suppose the Sherwin-Williams Company has developed the following multiple regression model, with…
A: Given that, Y=α+βaA+βp P+ε α=344.585 ba =0.102 bp…
Q: give handwritten answer of the question- Which one of the following is the most used model or…
A:
Q: In a study to predict temperature from air pressure in a piston-cylinder device, 19 measurements…
A:
Q: We wish to predict the salary for baseball players (y) using the variables RBI (x1) and HR (x2),…
A: (a) Use EXCEL to obtain the regression equation. EXCEL procedure: Go to EXCEL Go to…
Q: The table below shows the number of state-registered automatic weapons and the murder rate for…
A: Regression: The regression analysis is conducted here by using EXCEL. The software procedure is…

Step by step
Solved in 3 steps

- Olympic Pole Vault The graph in Figure 7 indicates that in recent years the winning Olympic men’s pole vault height has fallen below the value predicted by the regression line in Example 2. This might have occurred because when the pole vault was a new event there was much room for improvement in vaulters’ performances, whereas now even the best training can produce only incremental advances. Let’s see whether concentrating on more recent results gives a better predictor of future records. (a) Use the data in Table 2 (page 176) to complete the table of winning pole vault heights shown in the margin. (Note that we are using x=0 to correspond to the year 1972, where this restricted data set begins.) (b) Find the regression line for the data in part ‚(a). (c) Plot the data and the regression line on the same axes. Does the regression line seem to provide a good model for the data? (d) What does the regression line predict as the winning pole vault height for the 2012 Olympics? Compare this predicted value to the actual 2012 winning height of 5.97 m, as described on page 177. Has this new regression line provided a better prediction than the line in Example 2?Suppose the Sherwin-Williams Company is interested in developing a simple regression model with paint sales (Y) as the dependent variable and selling price (P) as the independent variable. Complete the following worksheet and then use it to determine the estimated regression line. Sales Region Selling Price Sales ($/Gallon) (x 1000 Gal) ii xixi yiyi xixiyiyi xi2xi2 yi2yi2 1 15 160 2,400 225 25,600 2 13.5 220 2,970 182.25 48,400 3 16.5 140 2,310 272.25 19,600 4 14.5 190 2,755 210.25 36,100 5 17 120 2,040 289 14,400 6 16 160 2,560 256 25,600 7 13 210 2,730 169 44,100 8 18 150 2,700 324 22,500 9 12 220 2,640 144 48,400 10 15.5 190 2,945 240.25 36,100 Total 151 1,760 26,050 2,312 320,800 Regression Parameters Estimations Slope (ββ) -16.49 Intercept (αα) 424.98 In words, for a dollar increase in the selling price, the expected sales will increase by 2,640 gallons in a given sales region.…Suppose the Sherwin-Williams Company is interested in developing a simple regression model with paint sales (Y) as the dependent variable and selling price (P) as the independent variable. Complete the following worksheet and then use it to determine the estimated regression line. Sales Region Selling Price Sales ($/Gallon) (x 1000 Gal) ii xixi yiyi xixiyiyi xi2xi2 yi2yi2 1 15 160 2,400 225 25,600 2 13.5 220 2,970 182.25 48,400 3 16.5 140 2,310 272.25 19,600 4 14.5 190 2,755 210.25 36,100 5 17 120 2,040 289 14,400 6 16 160 2,560 256 25,600 7 13 210 2,730 169 44,100 8 18 150 2,700 324 22,500 9 12 210 2,520 144 44,100 10 15.5 190 2,945 240.25 36,100 Total 151 1,750 2,312 What is the estimate of the standard deviation of the estimated slope (sbsb)? 2.627 3.173 2.877 Can you reject the hypothesis (at the 0.05 level of significance) that there is no relationship (i.e., β=0β=0) between the…
- In a laboratory experiment, data were gathered on the life span (y in months) of 33 rats, units of daily protein intake (x1), and whether or not agent x2 (a proposed life-extending agent) was added to the rats' diet (x2 = 0 if agent x2 was not added, and x2 = 1 if agent was added). From the results of the experiment, the following regression model was developed:ŷ = 36 + .8x1 − 1.7x2Also provided are SSR = 60 and SST = 180.The test statistic for testing the significance of the model is _____. a. 5.00 b. .50 c. .25 d. .33Given are five observations for two variables, x and y. xi 1 2 3 4 5 yi 4 6 6 11 13 Develop the estimated regression equation by computing the values of b0 and b1 using b1 = Σ(xi − x)(yi − y) Σ(xi − x)2 and b0 = y − b1x. ŷ = (e) Use the estimated regression equation to predict the value of y when x = 2.Suppose a study wants to predict the market price of a certain species of turtle (Y) based on the following independent variables indicated in the table. Based from the table, what is the equation of the multiple linear regression? (Round off up to two decimal places. Market Price = 0.07 - 0.40*weight + 1.51*length + 1.41*width + 0.80*age Market Price = - 0.40*weight + 1.51*length + 1.41*width + 0.80*age Market Price = 0.07 + 0.40*weight + 1.51*length + 1.41*width + 0.80*age Market Price = 0.07 - 0.40 + weight + 1.51 + length + 1.41 + width + 0.80 + age
- A group of Maternal and Child Health public health practitioners are interested in the relationship between bacterial vaginosis (BV) and a number of negative health outcomes. Suppose the research team gathers information on a group of participants, and constructs a multiple linear regression model looking at the relationship between BV and depression, controlling for maternal age. The following is a computerized output displaying the results of their analysis.Parameter Intercept Maternal Age DepressionEstimate StandardError tValue Pr>|t|0.2186206635 -.0046496845 0.19124124150.06635040 0.00221338 0.031518843.29 0.0010 -2.10 0.0360 6.07 <.0001 A) What are the dependent and independent variables in this investigation?B) Based on the information above, was the research team justified in controlling for maternal age in this population? Why or why not?C) Write out the model in symbols. Round to 3 decimal places.D) Is there a significant association between BV and depression?The monthly premium quoted by an insurance company for a critical illness policy was collected from a sample of 6 adult male smokers at different age. The data for the sample are shown: Age 28 25 50 39 47 31 Premium ($) 75 40 175 125 250 105 Using Age to predict premium, the Linear Regression equation is given by: ŷ =6.556X−112 and r2=0.813y^=6.556X−112 and r2=0.813 a. Identify the independent and Dependent variables. Dependent: Age Premium Independent: Age Premium b. Determine the slope. Slope = Slope = Round to 3 decimal places c. Determine |r||r| . |r|=|r|= Round to 3 decimal places d. Interpret rr : and e. Determine critical r value at 5% significance level and determine if there is a significant linear correlation exists. |r| critical=|r| critical= Round to 3 decimal places Linear Correlation:Linear Correlation: Significant Not Significant f. Predict the monthly premium for a 40 years old adult male smoker.…The table presents data on the taste test of 38 brands of pinot noir wine [data were first reported in an article by Kwan, Kowalski, and Skogenboe in the Journal Agricultural and Food Chemistry (1979, Vol. 27), the response variable is y = quality, and we want to find the "best" regression equation that relates quality to the other five parameters
- The following is the estimation results for a multiple linear regression model: Y = Bo + BX, + Bxz + 8 SUMMARY OUTPUT Regression Statistics R-Square Regression Standard Error (S) Observations 0.558 863.100 35 Coeff StdError 1283.000 352.000 25.228 8.631 0.861 0.372 t-Stat 3.65 Intercept X] X2 Questions: Write the fitted regression equation (30 points). 2 Write the estimated intercepts and slopes, associated with their corresponding standard errors (30 points). 3 Interpret each coefficient.The following table shows the annual number of PhD graduates in a country in various fields. NaturalSciences Engineering SocialSciences Education 1990 70 10 60 30 1995 130 40 120 50 2000 330 130 280 140 2005 490 370 460 210 2010 590 550 830 520 2012 690 590 1,000 900 (a) With x = the number of social science doctorates and y = the number of education doctorates, use technology to obtain the regression equation. (Round coefficients to three significant digits.) y(x) = Graph the associated points and regression line. (b) What does the slope tell you about the relationship between the number of social science doctorates and the number of education doctorates? The slope tells us the increase in the number of education doctorates for each additional social science doctorate.The slope tells us the decrease in the number of education doctorates for each additional social science doctorate. The slope tells us the increase in the number…The following table shows the annual number of PhD graduates in a country in various fields. NaturalSciences Engineering SocialSciences Education 1990 70 10 70 30 1995 130 40 110 50 2000 330 130 280 140 2005 490 370 460 210 2010 590 550 830 520 2012 690 590 1,000 900 (a) With x = the number of social science doctorates and y = the number of education doctorates, use technology to obtain the regression equation. (Round coefficients to three significant digits.) y(x) = Graph the associated points and regression line. (b) What does the slope tell you about the relationship between the number of social science doctorates and the number of education doctorates? The slope tells us the increase in the number of social science doctorates for each additional education doctorate.The slope tells us the increase in the number of education doctorates for each additional social science doctorate. The slope tells us the decrease in the number…