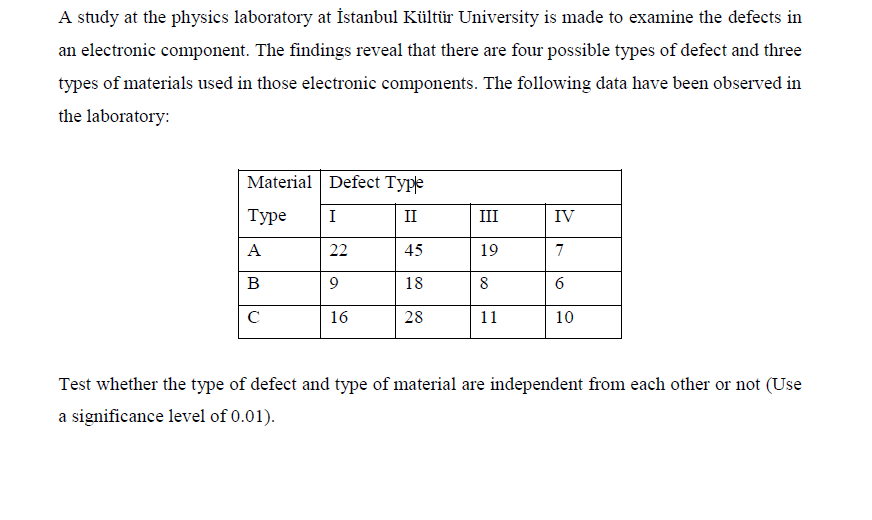
A study at the physics laboratory at Istanbul Kültür University is made to examine the defects in an electronic component. The findings reveal that there are four possible types of defect and three types of materials used in those electronic components. The following data have been observed in the laboratory: Material Defect Type Туре II III IV A 22 45 19 7 B 18 8 16 28 11 10


Q: An economist is studying the job market in Denver area neighborhoods. Let x represent the total…
A: Scatter PlotIt is a Graph between two variables. It is plotted to check the relationship between the…
Q: 11 12 13 14 D 12 3 4 5 6 570 539 580 488 610 418 477 329 398 377 352 627 504 375 tudent 7 8 10 core…
A: First Second D (D-Dbar)^2 570 576 -6 71.04082 539 551 -12 5.897959 580 605 -25 111.7551 488…
Q: 8-56. + An article in the Australian Journal of Agricultural Research [“Non-Starch Polysaccharides…
A:
Q: If we have the model: Y = Bo + B1X1 + B2X2 + B3X3 + B4X4 + e And we wish to test the usefulness of…
A: Provided information is ; Y = β0 + β1X1+β2X2+β3X3+β4X4+ε Now we have to find Null hypothesis to…
Q: The following are smoke readings taken on two different camshafts: Engine Camshaft A Camshaft B A…
A: Here we are use Wilcoxon signed rank test, Therefore, the hypotheses are, Calculation table:…
Q: Q : A researcher specities the tollowing model ot human capital HC a t+a,RM +a2Y +a,HS +a SC +asEDH…
A: Human capital expenditure rises by 2010 units if the household receives remittances. Human capital…
Q: The following table contains the population at each center: 4 5 6 7 8 7 8 8 3 6 15 Center I 2 3 9.…
A: The 6 centers with highest population are (in decreasing order): 3, 10, 12, 6, 11, (7 or 5) with…
Q: (no subject) - gustaviafrankling x i…
A: Given that To find the distance between the two poles to the nearest foot is
Q: Which of these four forecasts seems to have the most bias? A. (6,4,3,2) B. 3-period moving average…
A: Introduction: Given that the four forecasts are: (6, 4, 3, 2), 3P avg, Alpha 0.3 and SMA. One of the…
Q: The data table shows the yields for a one-year certificate of deposit (CD) and a five-year CD for…
A: Given: The data table shows the yields for a one-year certificate of deposit (CD) and a five-year…
Q: Given components with the following reliabilities: A = 0.99, B = 0.98, C= 0.97. What is the…
A:
Q: 3. The measured soil water content of 16 samples at four depths is as follows: Soil Water contents (…
A:
Q: A dietician prepares a diet specifying the amounts a patient should eat of the four basic food…
A: We are asked to write a matrix for given information.
Q: Consider the following information for a set of three ARMA models: ARMA(1,0), ARMA(1,1) and…
A: AIC Values: AIC values are used for identifying the best fit of the model by comparing the other…
Q: The following data were obtained to examine the effects of anxiety levels (low and high) and 3…
A: Two-way ANOVA: Analysis of Variance is known as ANOVA, it is a hypothesis testing to compare the…
Q: Consider the following model constructed by researchers investigating the relationship between blood…
A: Multiple regression model: multiple regresion model is, yi=β0+β1×xi1+β2×xi2.......+βn×xin+εwhere,…
Q: Consider the following data from a sample of 10 plastic bags filled with a talcum power we…
A: Given: Mean weight filled plastic bags = 0.3900, mean weight of only powder = 0.1720.
Q: 17. The time-phased net requirements for the base assembly in a table lamp over the next six weeks…
A: Since you have posted a question with multiple sub-parts, we will solve first three subparts for…
Q: Human blood types are classified by three gene forms A, B, and O. Blood types AA, BB, and OO are…
A:
Q: Genel sınav değerlendirmesi için, tüm öğrencilerimin iki farklı modele KALMAN FİLTRESİNİ uygulaması…
A: Pls convert this question on English language. I can't understand it..sry.
Q: Pathway: Health Sciences Cancer Type Men Women Breast 191105 Cervix uteri 110749 Thyroid Leukemia…
A: Since you have posted a question with multiple sub parts, according to our guidelines we can solve…
Q: 7) Season Tickets Sold 8) 100 80 60 + 40 20 2000 2004 2006 2008 1998 2002 2010 Vehicle Weight Year…
A: A scatter plot diagram helps in understanding the relationship/ association between two variables.…
Q: 8-56. + An article in the Australian Journal of Agricultural Research ["Non-Starch Polysaccharides…
A: We have given that, The soybean meals is (g/kg) :- 22.2, 24.7, 20.9, 26.0, 27.0, 24.8, 26.5,…
Q: 1. a. Define briefly the following terminologies in relation to a 22 factorial design i. Standard…
A: Standard order:- the order of writing the treatment is called the standard order. Total effect of A…
Q: By various methods of selecting variables, 7 good models are considered with following numerical…
A: Since you have posted a question with multiple sub-parts, we will solve the first three sub-parts…
Q: 1. The following table shows the record of time spent (minutes) preparing self- learning modules per…
A: To compare all the groups, we should calculate the average time spent on preparing self learning…
Q: 1. Compares the number of males to the number of females 1) Sex structure: Sex Composition 2) Sex…
A: Given problem Given that 1) Compares the number of males to the number of females Ans) Sex…
Q: (k) Last month, the TSE Index's monthly rate of return was 1.5%. This is, at the end of last month…
A: TSERofReturn Xi AcmeRofReturn Yi Predicted AcmeRofReturn Y^i Yi-Y^i2 0.42478 -0.48194 0.187993493…
Q: NO 4 Solve and show the complete solution.
A: Applying the technique of center of gravity Weighted coordinates = Multiply W with X…
Q: The following are the demand and supply functions for three competing mobile phone models of…
A: Given demand and supply function for three competing mobile phone models of different manufacturers…
Q: 7. Consider the two data sets 41 and X 2 [3 [1 X = 5 4 5 7 for which [2] 31 = | 4 5 and [1 S pooled…
A: Given: X1=124535& X2=324957x1=24, x2=35& Spooled=1112
Q: Data from a study of two air lines fly to Small Town Flights on Time Flights Late Podunk…
A: Let A be the event that Flights are on time and B be the event that Flights are late. Also, let C be…
Q: 17. The time-phased net requirements for the base assembly in a table lamp over the next six weeks…
A: (d) Part period balancing method 335 200 140 440 300 200 factor 0.5 1.5 2.5 0.5 1.5 2.5…
Q: In Exercises 21-24 use the given data to construct the best approximate linear iterative model. 21.…
A: Given - Use the given data to construct the best approximate linear iterative model. To find - S0 =…
Q: 4. Calculate SStotal, SSpetween» and SSwithin for the following set of data: Treatment 1 Treatment 2…
A:
Q: d Cut EE Copy ▼ H A 0 .00Conditional Format ste EEMerge & Center 00 a0 Format Painter Formatting-…
A: Question 1:Conditions:The conditions for the two proportion test for sample sizes n1 and n2 with…
Q: The article " The Ball-on-Three-Ball Test for Tensile Strength: Refined Methodology and Results for…
A:
Q: After the availability of covid 19 vaccinces in the Phiippines, the data below shows the number of…
A:
Q: Attachment
A: 16. a. The null and the alternative hypotheses are, H0: µ≤$3,173 (The mean credit card balance is…
Q: Given below is data about total mevenues Speofit fox the quader 4ome companies Calulate dul Corsonis…
A: From the given data
Q: 8-56. An article in the Australian Journal of Agricultural Research [“Non-Starch Polysaccharides and…
A: Steps : 1) Enter given data in column c1 of Minitab 2) Click 'Stat' ---> 'Basic Statistics'…
Q: A company are trying to establish if there is a link between the type of fault reported in…
A:
Q: 11: Motorman Corporation is contemplating the accompanying creation method along with different…
A:
Q: The table below shows worldwide smart phone sales by vendor. Worldwide Smartphone Sales to End Users…
A: Given
Q: 西☆ * X (total number of jobs (in hundreds)) x (total number of jobs 30 35 40 45 x (total number of…
A:
Q: A fruit juice producer conducted a study at a large supermarket to determine the possible influence…
A: Note: Hey, since there are multiple questions posted, we will answer first question. If you want any…
Q: 8-56. + An article in the Australian Journal of Agricultural Research [“Non-Starch Polysaccharides…
A: Note: Thank you for the question. We must note that Part d is an explanatory question that takes the…
Q: The following table gives the annual revenue for two different companies (in billions of dollars)…
A:

Step by step
Solved in 4 steps with 6 images


- Suppose a researcher is interested inthe effectiveness in a new childhood exercise program implemented in a SRS of schools across a particular county. In order to test the hypothesis that the new program decreases BMI (Kg/m2), the researcher takes a SRS of children from schools where the program is employed and a SRS from schools that do not employ the program and compares the results. Assume the following table represents the SRSs of students and their BMIs. Student intervention group BMI (kg/m2) Student control group BMI (kg/m2) A 18.6 A 21.6 B 18.2 B 18.9 C 19.5 C 19.4 D 18.9 D 22.6 E 24.1 F 23.6 A) Assuming that all the necessary conditions are met (normality, independence, etc.) carry out the appropriate statistical test to determine if the new exercise program is effective. Use an alpha level of 0.05. Do not assume equal variances.B) Construct a 95% confidence interval about your estimate for the average difference in BMI between the groups.A researcher was interested in studying if there is a significant relationship between the severity of COVID 19 and blood types of individuals. 2400 individuals were studied and the results are shown below. blood types condition O A B AB Total critical 64 44 20 8 136 severe 175 129 50 15 369 moderate 211 528 151 125 1015 mild 200 400 140 140 880 total 650 1101 361 288 2400 a. State both the null and alternative hypotheses. b. Provide the decision rule for making this decision. Use an alpha level of 5%. c. Show all of the work necessary to calculate the appropriate statistic. d. What conclusion are you allowed to draw? e. Would your conclusion change at the 10% level of significance? [2 marks]A panel of dentists is interested in testing two different toothpaste brands (A and B) to see if there is a relationship between the brand and whether or not the patient has a cavity at their next appointment. A representative sample of 60 patients is recruited to take part in the study. At their first appointment of the year, each subject is assigned to brush their teeth with one of the two brands for the next six months. At their follow-up appointment six months later, they were checked for cavities. What method of data collection was used? Select one: a.Experiment b.Observational Study
- A panel of dentists is interested in testing two different toothpaste brands (A and B) to see if there is a relationship between the brand and whether or not the patient has a cavity at their next appointment. A representative sample of 60 patients is recruited to take part in the study. At their first appointment of the year, each subject is assigned to brush their teeth with one of the two brands for the next six months. At their follow-up appointment six months later, they were checked for cavities. To test for significance of their findings, which of the following should the dentists use? Select one: a.Paired t-test b.One-sample t-test for a mean c.Linear Regression d.One-sample Z-test for a proportion e.Chi-Square test for independence f.Two-Sample t-test g.One-sample Z-test for a meanA researcher was interested in studying if there is a significant relationship between the severity of COVID 19 and blood types of individuals. 2400 individuals were studied and the results are shown below. Condition Blood Type O A B AB Total Critical 64 44 20 8 136 Severe 175 129 50 15 369 Moderate 211 528 151 125 1015 Mild 200 400 140 140 880 Total 650 1101 361 288 2400 a. State both the null and alternative hypotheses.b. Provide the decision rule for making this decision. Use an alpha level of 5%. c. Show all of the work necessary to calculate the appropriate statistic.d. What conclusion are you allowed to draw?e. Would your conclusion change at the 10% level of significance?f. Confirm test results in part (c) using JASP. Note: All JASP input files and outputtables should be providedA researcher was interested in studying if there is a significant relationship between the severity of COVID 19 and blood types of individuals. 2400 individuals were studied and the results are shown below. Condition Blood Type O A B AB Total Critical 64 44 20 8 136 Severe 175 129 50 15 369 Moderate 211 528 151 125 1015 Mild 200 400 140 140 880 Total 650 1101 361 288 2400 a. State both the null and alternative hypotheses. b. Provide the decision rule for making this decision. Use an alpha level of 5%. c. Show all of the work necessary to calculate the appropriate statistic. d. What conclusion are you allowed to draw? e. Would your conclusion change at the 10% level of significance?
- A panel of dentists is interested in testing two different toothpaste brands (A and B) to see if there is a relationship between the brand and whether or not the patient has a cavity at their next appointment. A representative sample of 60 patients is recruited to take part in this study. At their first appointment of the year, each subject is assigned to brush their teeth with one of the two brands for the next six months. At their follow-up appointment six months later, they were checked for cavities. ******In the sample, 6 of the 30 patients assigned to Brand A were found to have a cavity. The fraction 6/30 should be denoted by which of the following? μ x̄ p p̂ n s σ χ²A study was conducted in 1997 to measure the total fat content, calories, and sodium content of vegetable burgers available at supermarkets and commonly used as a meat substitute. Measurements on 54 different brands of "veggie burgers," and the results were used to develop the 3-way contingency table below. Under 130 Calories Under 130 Calories 130 Calories or More 130 Calories of More Total Fat Content Under 320 g Sodium 320 g Sodium or More Under 320 g of Sodium 320 g Sodium or More Under 3 g 6 12 1 1 3-4 g 7 4 3 5 Over 4 g 1 1 7 6 A= {"Under 130 Calories"}, B= {"320 g Sodium or More"} C= {"Over 4 g Total Fat"} A vegetable burger is selected randomly from the group. Find the following probabilities: Please Answer D, E, F (d.) P(A and B) (e.) P(A and B and C) (f.) P(A or B)A study was conducted in 1997 to measure the total fat content, calories, and sodium content of vegetable burgers available at supermarkets and commonly used as a meat substitute. Measurements on 54 different brands of "veggie burgers," and the results were used to develop the 3-way contingency table below. Under 130 Calories Under 130 Calories 130 Calories or More 130 Calories of More Total Fat Content Under 320 g Sodium 320 g Sodium or More Under 320 g of Sodium 320 g Sodium or More Under 3 g 6 12 1 1 3-4 g 7 4 3 5 Over 4 g 1 1 7 6 A= {"Under 130 Calories"}, B= {"320 g Sodium or More"} C= {"Over 4 g Total Fat"} A vegetable burger is selected randomly from the group. Find the following probabilities: Please Answer A, B, & C (a.) P(A) (b.) P(B) (c.) P(C)
- In a study of chromosomal anomalies observed in a randomly selected sample of 1200 infertile men with either a zero or low sperm count, a team of researchers assigned the value of 1 for the presence of any chromosomal anomaly in the subject's sperm and the value of 0 for the absence of all chromosomal anomalies in the subject's sperm.Of the 600 men with zero sperm count, 48 had chromosomal anomalies. Of the 600 men with low sperm count, 15 had chromosomal anomalies. The researchers would like to test the hypothesesHo: P1 = P2Ha: P1 does not equal P2where p₁ the true proportion of all men with zero sperm count that have chromosomal anomalies and p₂ = the true proportion of all men with low sperm count that have chromosomal anomalies.What is the z standardized test statistic, for this test?A researcher was interested in studying if there is a significant relationship between the severity of COVID 19 and blood types of individuals. 2400 individuals were studied and the results are shown below. Condition Blood Type O A B AB Total Critical 64 44 20 8 136 Severe 175 129 50 15 369 Moderate 211 528 151 125 1015 Mild 200 400 140 140 880 Total 650 1101 361 288 2400 State both the null and alternative hypotheses. Provide the decision rule for making this decision. Use an alpha level of 5%. Show all of the work necessary to calculate the appropriate statistic. What conclusion are you allowed to draw? . Would your conclusion change at the 10% level of significance?The article “Differences in Susceptibilities of Different Cell Lines to Bilirubin Damage” (K. Ngai, C. Yeung, and C. Leung, Journal of Paediatric Child Health, 2000:36–45) reports an investigation into the toxicity of bilirubin on several cell lines. Ten sets of human liver cells and 10 sets of mouse fibroblast cells were placed into solutions of bilirubin in albumin with a 1.4 bilirubin/albumin molar ratio for 24 hours. In the 10 sets of human liver cells, the average percentage of cells surviving was 53.9 with a standard deviation of 10.7. In the 10 sets of mouse fibroblast cells, the average percentage of cells surviving was 73.1 with a standard deviation of 9.1. Find a 98% confidence interval for the difference in survival percentages between the two cell lines.