A study was conducted to look at the relationship between of citations a nursing home has received for failure to control infectious diseases and the number of COVID-19 cases the home has had. The results are shown below. (Disclaimer: data is randomized and simulated, but these findings are based on real information.) Hint: You can copy and paste these data into the Linear Regression App in Art of Stat, simply by hitting enter your own. Citations Cases 4 50 44 67 33 1 34 7 24 6. 83 4. 9. 125 10 145 23
A study was conducted to look at the relationship between of citations a nursing home has received for failure to control infectious diseases and the number of COVID-19 cases the home has had. The results are shown below. (Disclaimer: data is randomized and simulated, but these findings are based on real information.) Hint: You can copy and paste these data into the Linear Regression App in Art of Stat, simply by hitting enter your own. Citations Cases 4 50 44 67 33 1 34 7 24 6. 83 4. 9. 125 10 145 23

College Algebra
7th Edition
ISBN:9781305115545
Author:James Stewart, Lothar Redlin, Saleem Watson
Publisher:James Stewart, Lothar Redlin, Saleem Watson
Chapter1: Equations And Graphs
Section: Chapter Questions
Problem 10T: Olympic Pole Vault The graph in Figure 7 indicates that in recent years the winning Olympic men’s...

Related questions
Question
Need answers to all the blank ones and check my work ASAP
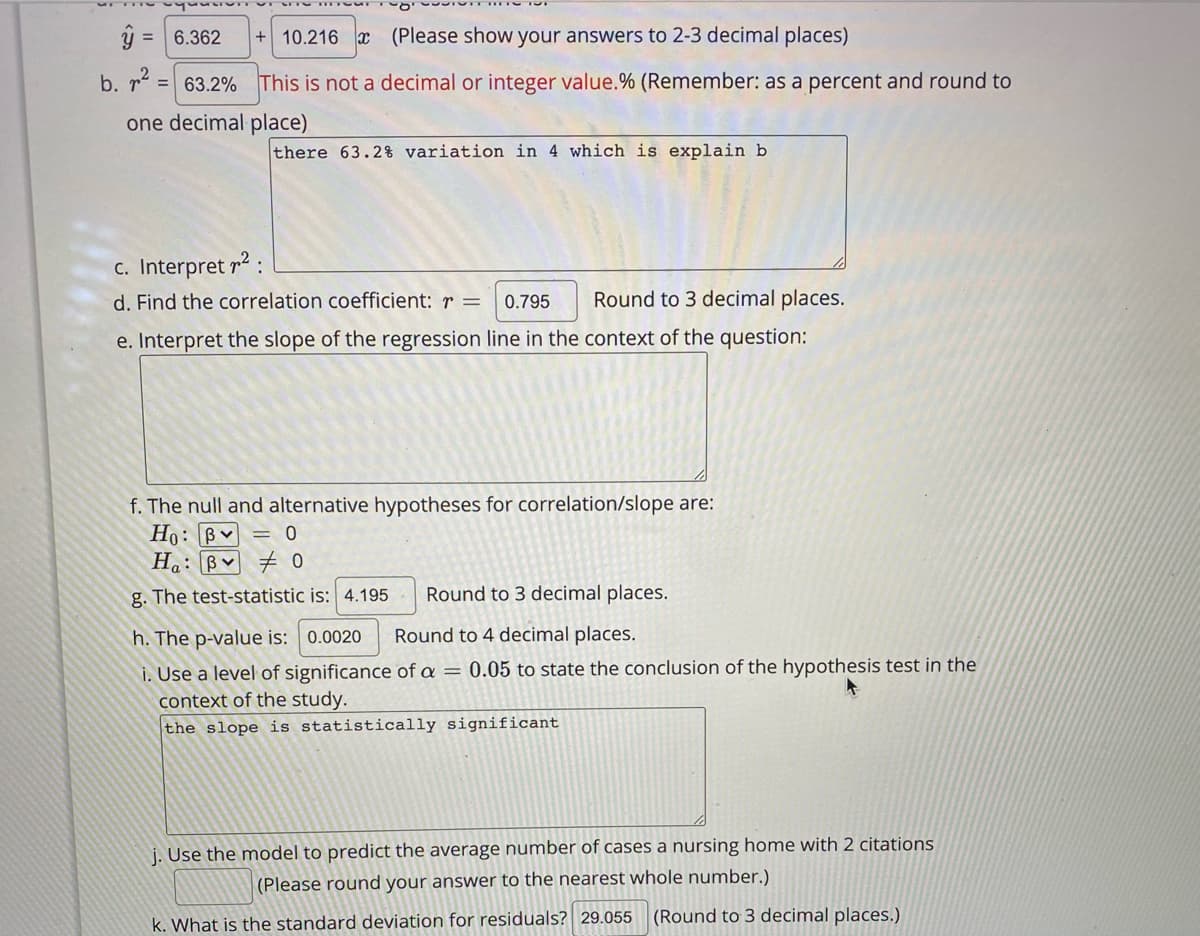
Transcribed Image Text:ý = 6.362
+10.216 x (Please show your answers to 2-3 decimal places)
b. r = 63.2% This is not a decimal or integer value.% (Remember: as a percent and round to
one decimal place)
there 63.2% variation in 4 which is explain b
c. Interpret r2 :
d. Find the correlation coefficient: r =
0.795
Round to 3 decimal places.
e. Interpret the slope of the regression line in the context of the question:
f. The null and alternative hypotheses for correlation/slope are:
Ho: Bv = 0
H: B O
g. The test-statistic is: 4.195
Round to 3 decimal places.
h. The p-value is: 0.0020
Round to 4 decimal places.
i. Use a level of significance of a =
context of the study.
the slope is statistically significant
0.05 to state the conclusion of the hypothesis test in the
j. Use the model to predict the average number of cases a nursing home with 2 citations
|(Please round your answer to the nearest whole number.)
(Round to 3 decimal places.)
k. What is the standard deviation for residuals? 29.055
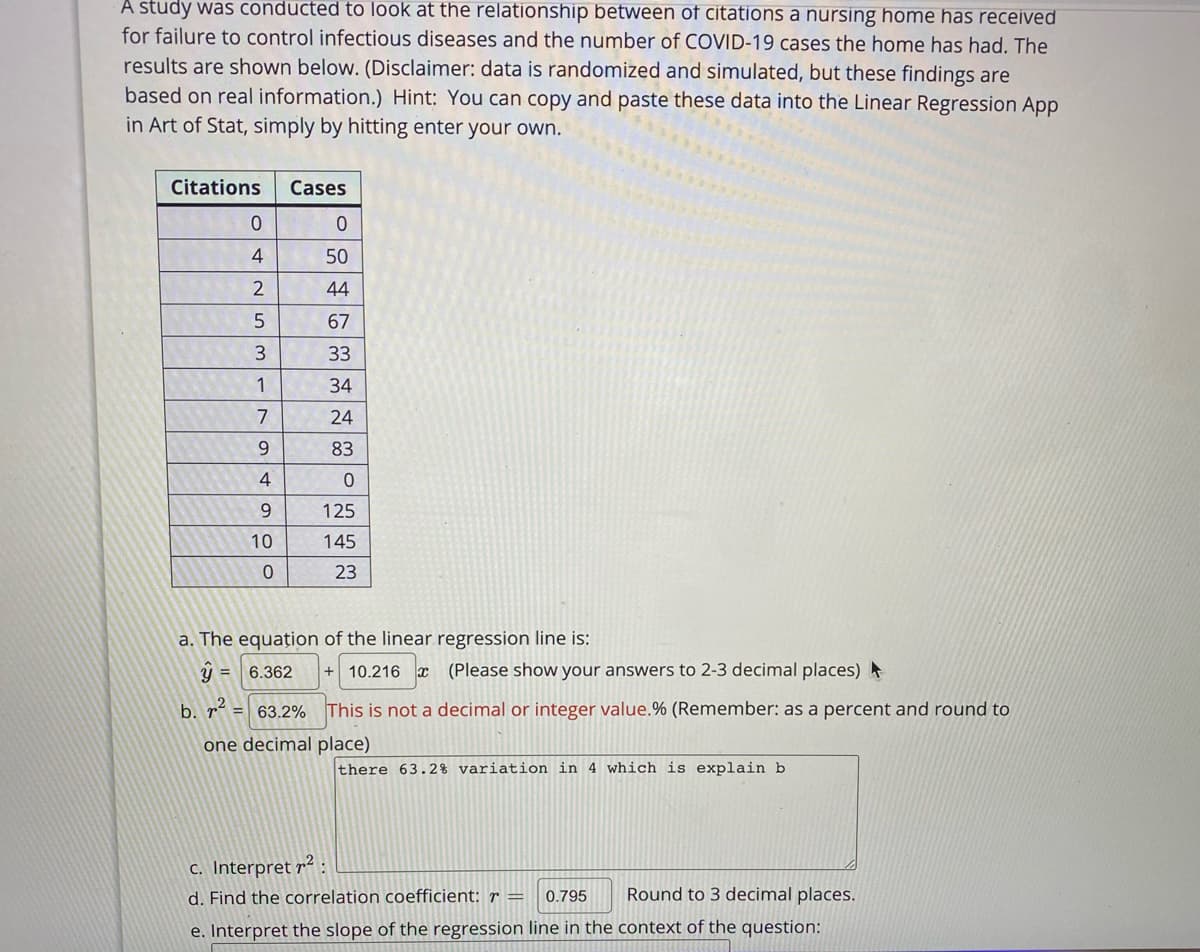
Transcribed Image Text:A study was conducted to look at the relationship between of citations a nursing home has received
for failure to control infectious diseases and the number of COVID-19 cases the home has had. The
results are shown below. (Disclaimer: data is randomized and simulated, but these findings are
based on real information.) Hint: You can copy and paste these data into the Linear Regression App
in Art of Stat, simply by hitting enter your own.
Citations
Cases
4
50
44
67
Ww.3
33
1
34
7
24
9.
83
4
9.
125
10
145
23
a. The equation of the linear regression line is:
y =
6.362
10.216 x (Please show your answers to 2-3 decimal places)
b. r2
63.2% This is not a decimal or integer value.% (Remember: as a percent and round to
%3D
one decimal place)
there 63.2% variation in 4 which is explain b
c. Interpret r²
d. Find the correlation coefficient: r =
0.795
Round to 3 decimal places.
e. Interpret the slope of the regression line in the context of the question:
Expert Solution
This question has been solved!
Explore an expertly crafted, step-by-step solution for a thorough understanding of key concepts.

Step by step
Solved in 3 steps

Knowledge Booster


Learn more about
Need a deep-dive on the concept behind this application? Look no further. Learn more about this topic, statistics and related others by exploring similar questions and additional content below.Recommended textbooks for you
College Algebra
Algebra
ISBN:
9781305115545
Author:
James Stewart, Lothar Redlin, Saleem Watson
Publisher:
Cengage Learning

Glencoe Algebra 1, Student Edition, 9780079039897…
Algebra
ISBN:
9780079039897
Author:
Carter
Publisher:
McGraw Hill
College Algebra
Algebra
ISBN:
9781305115545
Author:
James Stewart, Lothar Redlin, Saleem Watson
Publisher:
Cengage Learning
Glencoe Algebra 1, Student Edition, 9780079039897…
Algebra
ISBN:
9780079039897
Author:
Carter
Publisher:
McGraw Hill