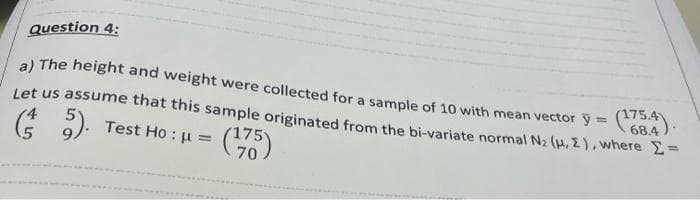
a) The height and weight were collected for a sample of 10 with mean vector y = 684 et us assume that this sample originated from the hi %3D 4 Test Ho (175


Q: An articde in the ACI Materials Journal (val. 84, 1987, pp. 213-216) describes several experiments…
A: F test is used to make conclusions in the anova table. Anova table is used to measure the mean…
Q: Question 10W A round spinner is divided into five sections, where the sections do not have the same…
A: according to our guidelines we can answer only first question and rest can be re posted. From the…
Q: A study conducted at Ateneo de Naga University revealed that students who attended class 95 to 100%…
A: Given: Number of students in research N=5000 Number of students participated in survey n=100
Q: A artide in the ACI Materials Joumal (vol. 4, 1987. pp. 213-216) describes several experiments…
A:
Q: Data from the Motor Vehicle Department indicate that 80% of all licensed drivers are older than age…
A: (A). Propose the suitable analysis: Denote the proportion of licensed drivers who are older than 25…
Q: The article "Modeling of Urban Area Stop-and-Go Traffic Noise" (P. Pamanikabud and C.…
A: Hypotheses and level of significance: Denote μ1 and μ2 as the mean noise level between acceleration…
Q: Give a practical formula for computing the principal unit normalvector.
A: To define: Principal Unit Normal Vector. To write the formula for Principal Unit Normal Vector.
Q: i. Compute the Wilk's lambda? Technical Paper. STS 483. April 2021 ii. Test whether there is…
A: We have selected a random sample on 4 cost variables(X1, X2, X3, X4) from three different groups…
Q: Compute the sum-of-squares error (SSE) by hand for the given set of data and linear model. (4, 4),…
A: (4, 4), (5, 5), (6, 7); y = x − 1 Plunging each value of x in in the equation and let us find
Q: 2.88 Characteristics of a rockfall. Refer to the Environmental O Geology (Vol. 58, 2009) study of…
A: For the given data Find Range = ? Variance = ? Standard deviation = ?
Q: The article "Application of Analysis of Variance to Wet Clutch Engagement" (M. Mansouri, M.…
A:
Q: O Find the best least-squares approximation for the data Wi2),(1,2),(2,5),(3,4) by the linear…
A:
Q: Show that an equation of the normal line to the graph of %3D a b2 – a² at the point (a, b) is given…
A: we have to show that the equation of the normal line to the graph of xa7+yb7=2 at the point (a,b) is…
Q: Which of the non-parametric test for ordinal data is the best to use in the given scenario? An…
A: Given: An experiment was conducted to compare the strengths of two types of elastic bandages: one a…
Q: Interpret the estimated regression coefficient corresponding to the Z variable. Data Salary…
A: Multiple linear regression model: A multiple linear regression model is given as y = b0 + b1x1 +…
Q: The qualifications of 30 engineering students are shown below, corresponding to the subjects of…
A: A. The range for the subject Calculus is: Range(C) = Max(C) - Min(C) = 100-10 = 90 The range for…
Q: Conduct an Augmented Dickey fuller test of unit roots for each variable. b. Estimate the following…
A: Note: Hi there! Thank you for posting the question. As you have posted multiple questions, as per…
Q: Find the Fisher information in this sample of size n about the parameter 8.
A: First we have to calculate the log of f(x,θ) and its second derivative to determine the Fisher…
Q: Calculate C.I, Sample Skewness and Sample Kurtosis from the following grouped data: Class 5-15 15-25…
A:
Q: A professional golfer is shopping for a new brand of golf ball. He likes most of the features of one…
A:
Q: sidere a seguinte tabela de pontos do HHat -4 -2 0,11 0, 16 0, 20 0, 25 la tabela acima pelo Método…
A:
Q: 6. (.. Find the length of the vector of mismatches (the error vector) between the data set and a…
A:
Q: Suppose that the data points (x;,y;), i=1,2,...,n, fit an intercept-free linear regression model Yi…
A:
Q: Compute the sum of squares error (SSE) by hand for the given set of data and linear model:…
A:
Q: In a missile-testing program, one random variable of interest is the distance between the point at…
A:
Q: The following are a sample of observations on incoming solar radiation at a greenhouse: 12.1 39.6…
A: Hello! As you have posted more than 3 sub parts, we are answering the first 3 sub-parts. In case…
Q: A certain experiment produces the data {(0,2), (–1,–1), (-2,0), (1, 1)}. The least square curve y=…
A: From the given values, x y x2 xy x3 0 2 0 0 0 -1 -1 1 1 -1 2 0 4 0 8 1 1 1 1 1 2 2 6 2…
Q: Consider the data points (1, 0), (2, 1), and (3, 5). Compute the least squares error for the given…
A: GivenPoints (1,0) , (2,1) , (3,5) and line y = -2+2ny = -2 +2ny-2x+2 = 0
Q: 4. Show that the vector of observed residuals can be expressed as e = (I – H)e.
A:
Q: What is the best non-parametric test for the following problem? [Apakah ujian tidak berparameter…
A: Given that "According to Mendelian genetic principles, self-pollination of pink-flowered plants…
Q: Given the data in the following table for wave-soldering nonconformities, determine if there are any…
A: The null hypothesis is a simple statement about the value of the population parameter which is…
Q: Market research has provided data on the m band. Determine the equation of the medi mal places.
A: T-shirt Price (x) T-shirt sold (y) 25 1475 40 920 15 1960 20 1600 35 1100 10 2150 30…
Q: The article "Bone Density and Insertion Torque as Predictors of Anterior Cruciate Ligament Graft…
A: Given data: Torque (y) 1.8 2.2 1.9 1.3 2.1 2.2 1.6 2.1 1.2 1.8 2.6 2.5 2.5 1.7 1.6 Load (x) 491…
Q: Find the coefficient of skewness using Karl-Pearson's and Bowley's.
A: Obtain the median of the dataset: Given data represents the values of X = scores of intelligence…
Q: Q2 The following data is the pull strength of a wire bond in a semiconductor manufacturing process,…
A:
Q: EXER 5.1: Given the observations (1,1), (2,3), (4,5), find the least squares estimates for m and b…
A: Given: Equation of straight line is y=mx+b, where Slope is m and Intercept is b…
Q: A psychologist has measured the IQ for a group of 30 children, now in the third grade. who had been…
A: Given: X=104 μ = 100 σ = 16 n= 30 ∝ = 0.05
Q: Consider the data given in the table: lo Find the least square approximation function in the form y…
A:
Q: The value of the ___________ is used to estimate the value of the population parameter.
A: We know that sample is the best estimator of population parameter when the sample is taken randomly…
Q: -3. Fnd the lene Harmuph (1,2,-1Danl normal to the tarow plana 25-y +33a12
A: The given plane is 2x-y+3z=12 The direction ratio of the plane is 2, -1, 3 Hence the direction…
Q: Ising the principle of least-squares Fit curve of the form y=acl+b*) to the given data be lowi- 15…
A: Given fit curve Y= a+bX
Q: determine the following statement is a valid reason for using nonparametric methods? - We are…
A: Nonparametric methods are the tests, in which the data is not required to fit a normal distribution.…
Q: You are a graduate student in an M.D./Ph.D program, attempting a study of the efficacy of different…
A: Hello. Since your question has multiple sub-parts, we will solve the first three sub-parts for you.…
Q: The loading vectors of the first two principal components for a particular data set is given in the…
A: First check the tables given. Use the given two tables to approximate the value of variable x21.
Q: A researcher wants to compare three different exercise programs. For each program, five volunteers…
A:
Q: alculate the ordinary least squares (OLS) estimates of the coefficients
A: Hello, since your question has multiple parts, we will solve the first question for you. if you want…
Q: Compute the sum-of-squares error (SSE) by hand for the given set of data and linear model. (7, 7),…
A:
Q: Compute the sum-of-squares error (SSE) by hand for the given set of data and linear model. (8, 10),…
A: Prepare a table, as follows:
Please answer with explanation.
I will really upvote. Thanks

Step by step
Solved in 2 steps

- Solve the following problems based on the step-by-step procedure of the Non-Parametric Tests. Show complete solutions and answer. Use the following listed chest deceleration measurements (in g, where g is the force of gravity) from samples of small, midsize, and large cars. Use a 0.05 significance level to test the claim that the different size categories have the same median chest deceleration in the standard crash test. Small 44 39 37 54 39 44 42 Midsize 36 53 43 42 52 49 41 Large 32 45 41 38 37 38 33Given that Y1, Y2, Y3, ..., Yn is a random sample from a gamma distribution with parameters alfa = 3, and Beta = theta, find the mle of theta.32 Sick leave of employees in a factory before and after Covid-19 was investigated in a year. Which of the following is the test statistic value in the hypothesis of whether there is a difference between the sick leaves of the employees? (The data do not satisfy the parametric assumption). 32 - a) 15.5 B) 7.5 NS) 5.5 D) 3,5 TO) 9.5
- Question 5.4 D,E,F,G,H,I with bell curve drawingA study conducted at Ateneo de Naga University revealed that students who attended class 95 to 100% of the time usually received an A in the class. Students who attended class 80 to 90% of the time usually received a C+ to B+ in the class. Students who attended class less than 80% of the time usually received a D or an F or eventually withdrew from the class. In this research in AdNU with 5000 students in which 100 students participated in the survey, what is the parameter of the study? a. 80% b. 80 - 90% c. 100 d. 95 - 100 % e. 5000Given that X1, X2, and X3 are standard normal IID RVs. Find the joint pdf of (Y1, Y2) which are defined below: Y1 = X1 + X2 + X3 and Y2 = X1 + 2X2 - 3X3
- PART D,E,F A researcher wants to compare three different exercise programs. For each program, five volunteers follow it for a month and their weight losses are recorded below. Use a 0.01 significance level to test the claim that the three different exercise programs produce the same mean weight loss Program A: 2.5 8.8 7.3 9.8 5.1 Program B: 5.8 4.9 1.1 7.8 1.2 Program C: 4.3 6.2 5.8 8.1 7.9 a. Define the parameter(s) A. mu 1 equals The mean weight loss by the 5 people on program A mu 2 equals The mean weight loss by the 5 people on program B mu 3 equals The mean weight loss by the 5 people on program C B. mu 1 equals The mean weight loss by all people on program A mu 2 equals The mean weight loss by all people on program B mu 3 equals The mean weight loss by all people on program C C. mu equals The mean weight loss for all people D. p 1 equals The mean…The article in the ASCE Journal of Energy Engineering (1999, Vol. 125, pp.59-75) describes a study of the thermal inertia properties of autoclaved aerated concrete used as a building material. Five samples of the material were tested in a structure, and the average interior temperatures (°C) reported were as follows: 23.01, 22.22, 22.04, 22.62, and 22.59. Test that the average interior temperature is equal to 22.5°C using alpha (a) = 0.05. This problem is a test on what population parameter? What is the null and alternative hypothesis? What are the Significance level and type of test? What standardized test statistic will be used? What is the standard test statistic? What is the Statistical Decision? What is the statistical decision in the statement form?Solve the following problems based on the step-by-step procedure of the Non-Parametric Tests. Show complete solutions and answer. Listed below are amounts of strontium-90 (in millibecquerels, or mBq, per gram of calcium) in a simple random sample by baby teeth obtained from Pennsylvania residents and New York residents born after 1979. Use a 0.05 significance level and Wilcoxon rank-sum test to test the claim that the median amount of strontium-90 from Pennsylvania residents is the same as the median from New York residents. Pennsylvania 155 142 149 130 151 163 151 142 156 133 138 161 New York 133 140 142 131 134 129 128 140 140 140 137 143
- Wild irises are beautiful flowers found throughout the United States, Canada, and northern Europe. This problem concerns the length of the sepal (leaf-like part covering the flower) of different species of wild iris. Data are based on information taken from an article by R. A. Fisher in Annals of Eugenics (Vol. 7, part 2, pp. 179 -188). Measurements of sepal length in centimeters from random samples of Iris setosa (I), Iris versicolor (II), and Iris virginica (III) are as follows below. I II III 5.5 5.2 6.7 4.4 6.5 5.7 5.2 6.9 4.1 5.9 4.4 7.8 4.3 5.5 5.7 5.3 6.4 6.1 5.8 5.5 6.9 Shall we reject or not reject the claim that there are no differences among the population means of sepal length for the different species of iris? Use a 10% level of significance. (a) What is the level of significance? (b) Find SSTOT, SSBET, and SSW and check that SSTOT = SSBET + SSW. (Use 3 decimal places.) SSTOT = ? SSBET = ? SSW = ? Find d.f.BET, d.f.W, MSBET, and…Wild irises are beautiful flowers found throughout the United States, Canada, and northern Europe. This problem concerns the length of the sepal (leaf-like part covering the flower) of different species of wild iris. Data are based on information taken from an article by R. A. Fisher in Annals of Eugenics (Vol. 7, part 2, pp. 179 -188). Measurements of sepal length in centimeters from random samples of Iris setosa (I), Iris versicolor (II), and Iris virginica (III) are as follows below. I II III 5.5 5.2 6.8 4.6 6.5 5.3 5.1 6.1 4.4 5.5 4.1 7.9 4.1 5.1 5.9 5.4 6.1 6.9 5.4 5.1 6.6 Shall we reject or not reject the claim that there are no differences among the population means of sepal length for the different species of iris? Use a 5% level of significance. (a) What is the level of significance?State the null and alternate hypotheses. Ho: ?1 = ?2 = ?3; H1: Exactly two means are equal.Ho: ?1 = ?2 = ?3; H1: Not all the means are equal. Ho: ?1 = ?2 = ?3; H1:…Wild irises are beautiful flowers found throughout the United States, Canada, and northern Europe. This problem concerns the length of the sepal (leaf-like part covering the flower) of different species of wild iris. Data are based on information taken from an article by R. A. Fisher in Annals of Eugenics (Vol. 7, part 2, pp. 179 -188). Measurements of sepal length in centimeters from random samples of Iris setosa (I), Iris versicolor (II), and Iris virginica (III) are as follows below. I II III 5.7 5.1 6.5 4.7 6.2 5.1 4.7 6.6 4.7 5.8 4.9 7.5 4.6 5.2 5.3 5.3 6.2 6.2 5.4 5.8 6.4 (b) Find SSTOT, SSBET, and SSW and check that SSTOT = SSBET + SSW. (Use 3 decimal places.) SSTOT = SSBET = SSW = Find d.f.BET, d.f.W, MSBET, and MSW. (Use 4 decimal places for MSBET, and MSW.) dfBET = dfW = MSBET = MSW = Find the value of the sample F statistic. (Use 2 decimal places.)What are the degrees of freedom? (numerator) (denominator)