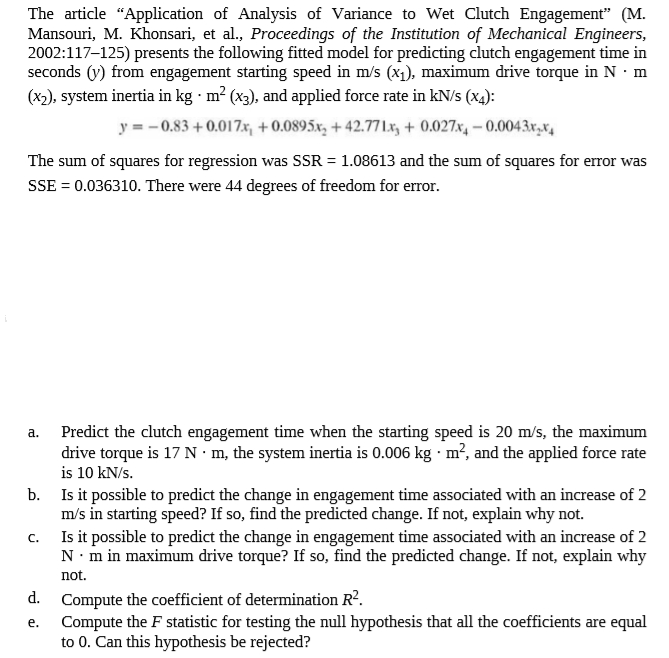
The article "Application of Analysis of Variance to Wet Clutch Engagement" (M. Mansouri, M. Khonsari, et al., Proceedings of the Institution of Mechanical Engineers, 2002:117-125) presents the following fitted model for predicting clutch engagement time in seconds (y) from engagement starting speed in m/s (x1), maximum drive torque in N · m (x2), system inertia in kg · m² (x3), and applied force rate in kN/s (x4): y = -0.83 + 0.017.x, + 0.0895x, + 42.77.xz + 0.027x, – 0.0043x,x, The sum of squares for regression was SSR = 1.08613 and the sum of squares for error was SSE = 0.036310. There were 44 degrees of freedom for error. Predict the clutch engagement time when the starting speed is 20 m/s, the maximum drive torque is 17 N·m, the system inertia is 0.006 kg · m², and the applied force rate is 10 kN/s. b. Is it possible to predict the change in engagement time associated with an increase of 2 m/s in starting speed? If so, find the predicted change. If not, explain why not. Is it possible to predict the change in engagement time associated with an increase of 2 N•m in maximum drive torque? If so, find the predicted change. If not, explain why not. a. C. Compute the coefficient of determination R?. Compute the F statistic for testing the null hypothesis that all the coefficients are equal to 0. Can this hypothesis be rejected? d. e.
The article "Application of Analysis of Variance to Wet Clutch Engagement" (M. Mansouri, M. Khonsari, et al., Proceedings of the Institution of Mechanical Engineers, 2002:117-125) presents the following fitted model for predicting clutch engagement time in seconds (y) from engagement starting speed in m/s (x1), maximum drive torque in N · m (x2), system inertia in kg · m² (x3), and applied force rate in kN/s (x4): y = -0.83 + 0.017.x, + 0.0895x, + 42.77.xz + 0.027x, – 0.0043x,x, The sum of squares for regression was SSR = 1.08613 and the sum of squares for error was SSE = 0.036310. There were 44 degrees of freedom for error. Predict the clutch engagement time when the starting speed is 20 m/s, the maximum drive torque is 17 N·m, the system inertia is 0.006 kg · m², and the applied force rate is 10 kN/s. b. Is it possible to predict the change in engagement time associated with an increase of 2 m/s in starting speed? If so, find the predicted change. If not, explain why not. Is it possible to predict the change in engagement time associated with an increase of 2 N•m in maximum drive torque? If so, find the predicted change. If not, explain why not. a. C. Compute the coefficient of determination R?. Compute the F statistic for testing the null hypothesis that all the coefficients are equal to 0. Can this hypothesis be rejected? d. e.

MATLAB: An Introduction with Applications
6th Edition
ISBN:9781119256830
Author:Amos Gilat
Publisher:Amos Gilat
Chapter1: Starting With Matlab
Section: Chapter Questions
Problem 1P

Related questions
Question
Transcribed Image Text:The article "Application of Analysis of Variance to Wet Clutch Engagement" (M.
Mansouri, M. Khonsari, et al., Proceedings of the Institution of Mechanical Engineers,
2002:117-125) presents the following fitted model for predicting clutch engagement time in
seconds (y) from engagement starting speed in m/s (x1), maximum drive torque in N · m
(x2), system inertia in kg · m² (x3), and applied force rate in kN/s (x4):
y = -0.83 + 0.017.x, + 0.0895x, + 42.77.xz + 0.027x, – 0.0043x,x,
The sum of squares for regression was SSR = 1.08613 and the sum of squares for error was
SSE = 0.036310. There were 44 degrees of freedom for error.
Predict the clutch engagement time when the starting speed is 20 m/s, the maximum
drive torque is 17 N·m, the system inertia is 0.006 kg · m², and the applied force rate
is 10 kN/s.
b. Is it possible to predict the change in engagement time associated with an increase of 2
m/s in starting speed? If so, find the predicted change. If not, explain why not.
Is it possible to predict the change in engagement time associated with an increase of 2
N•m in maximum drive torque? If so, find the predicted change. If not, explain why
not.
a.
C.
Compute the coefficient of determination R?.
Compute the F statistic for testing the null hypothesis that all the coefficients are equal
to 0. Can this hypothesis be rejected?
d.
e.
Expert Solution
This question has been solved!
Explore an expertly crafted, step-by-step solution for a thorough understanding of key concepts.

This is a popular solution!

Trending now
This is a popular solution!

Step by step
Solved in 4 steps with 5 images

Recommended textbooks for you
MATLAB: An Introduction with Applications
Statistics
ISBN:
9781119256830
Author:
Amos Gilat
Publisher:
John Wiley & Sons Inc

Probability and Statistics for Engineering and th…
Statistics
ISBN:
9781305251809
Author:
Jay L. Devore
Publisher:
Cengage Learning

Statistics for The Behavioral Sciences (MindTap C…
Statistics
ISBN:
9781305504912
Author:
Frederick J Gravetter, Larry B. Wallnau
Publisher:
Cengage Learning
MATLAB: An Introduction with Applications
Statistics
ISBN:
9781119256830
Author:
Amos Gilat
Publisher:
John Wiley & Sons Inc
Probability and Statistics for Engineering and th…
Statistics
ISBN:
9781305251809
Author:
Jay L. Devore
Publisher:
Cengage Learning
Statistics for The Behavioral Sciences (MindTap C…
Statistics
ISBN:
9781305504912
Author:
Frederick J Gravetter, Larry B. Wallnau
Publisher:
Cengage Learning

Elementary Statistics: Picturing the World (7th E…
Statistics
ISBN:
9780134683416
Author:
Ron Larson, Betsy Farber
Publisher:
PEARSON

The Basic Practice of Statistics
Statistics
ISBN:
9781319042578
Author:
David S. Moore, William I. Notz, Michael A. Fligner
Publisher:
W. H. Freeman

Introduction to the Practice of Statistics
Statistics
ISBN:
9781319013387
Author:
David S. Moore, George P. McCabe, Bruce A. Craig
Publisher:
W. H. Freeman