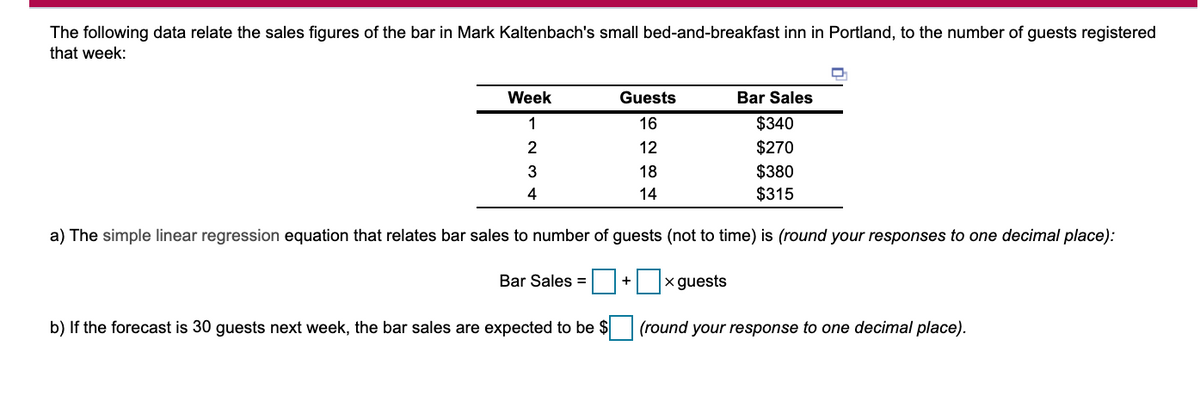
a) The simple linear regression equation that relates bar sales to number of guests (not to time) is (round your responses to one decimal place): Bar Sales =+ x guests b) If the forecast is 30 guests next week, the bar sales are expected to be $ (round your response to one decimal place).


Q: A check processing center uses exponential smoothing to forecast the number of incoming chewcks each…
A: A) Given forecast in the month of June = Sjune = 42 million Checks received in the month June =…
Q: What effect does the value of the smoothing constant have on the weight given to the recent values?
A: Exponential smoothing is a forecasting tool used to foresee univariate data. It forecasts is similar…
Q: a) b) would have applied the Naïve Model, calculate the Naïve Forecast values for the months of…
A: Answers of all parts is below:-
Q: Complete the forecasting worksheets for: Naïve Average Moving Average Weighted Moving Average…
A: Weighted Moving Average using the weights of .8, .15, and .05 ExponA using and an alpha level of .75…
Q: Jane is trying to forecast demand for her store, using Exponential Smoothing, using a = 0.75. Fill…
A: Forecast = Actual demand of previous period*alpha+(1-alpha)*forecast of previous period Error =…
Q: a) Using exponential smoothing and given a, the forecast for the month of July =million checks…
A: Below is the solution
Q: Please Analysis the graph, based on data
A: The statistical graphs are used to graphically represent the trend of consumer consumption pattern.…
Q: How is the moving average approach equivalent to exponential smoothing?
A: Forecasting is described as predicting future values based on past values, particularly in Time…
Q: Discusshow is moving average approach related to exponential smoothing?
A: Forecasting is the act of estimating future values based on historical data, most notably in the…
Q: The number of disk drives (in millions) made at a plant in Taiwan during the past 5 years follows.…
A: Given data:
Q: 1.Forecasts are essential for the ..............operations of business organizations. 2.In a simple…
A: Forecasting is the process of predicting future data based on previous or past data and information.…
Q: Explain what is the sensitivity analysis with Bayes decision rule used in the forecasting in…
A: Businesses use a method called vulnerability analysis to determine how output changes in response to…
Q: RDB Company wishes to assign a real estate brokers to one of its 6 sales districts. Based on the…
A: The assignment problem is solved to find out the maximized sales or the minimum cost that the…
Q: Using a 2-year moving average, the forecast for year 6 = miles (round your response to the…
A: Two year moving average is a forecasting tool which concluding the average demand of previous two…
Q: a. Naive. b. A four-period moving average. c. Exponential smoothing with .50. Use 20 for the week…
A: Forecasting is the process of prediction in which sales demand is estimated using historic…
Q: Exercise # 2 –Calculating MADt, Revised MADt,Error,and the Revised Error :Has the Forecast Improved…
A: 2 period moving average forecast for revising: -
Q: Lori Cook has developed the following forecasting modaly = 36 + 4.3xwhere y = demand for Kool Air…
A: Demand forecasting is described as the process through which estimations of the future are made over…
Q: Explain the effect of the value of a smoothing constant on the weight given to recent values
A: To be determined: the effect of the value of a smoothing constant on the weight given to recent…
Q: Which one of the methods is most accurate (Exponential smoothing or 3 month moving average) based on…
A: Straightforward Moving Average strategy In light of figure results utilizing MAD, Simple Moving…
Q: snip
A: Forecasting is the method of making predictions of the future based on past and present information…
Q: What are her forecasted sales for year 8 using a 3 year moving average? What are her forecasted…
A: Since you have posted a question with multiple sub-parts, we will solve the first three subparts for…
Q: Professor Shethinks Shesverybusy needs to allocate time this week for office appointments, so she…
A: Given data: The following formula will calculate the forecast for this week or the forecast for the…
Q: What is the impact on the weight assigned to recent values of the smoothing constant?
A: Smooth performance constant should have a value between 0 and 1.
Q: Describe how is the moving average approach equivalent to exponential smoothing?
A: Forecasting, most notably in Time Set, forecasts future values based on historical data. Two…
Q: Compare the exponential smoothing model when a=0 and when a=1
A: Exponential SmoothingThe formula for exponential smoothing model is:F(t) = F(t-1) + α (A(t-1) –…
Q: a) Using simple linear regression, the forecast for the number of disk drives to be made next year =…
A: In this question, for each year, I have disk drives data, using the Ms Excel software, I have…
Q: Attendance at Orlando's newest Disneylike attraction, Lego World, has been as follows:…
A: Quarter Year 1 Year 2 Year 3 Average Winter 63 64 94 (63+64+94) /3=73.667 Spring 99 83 151…
Q: Figure shows summer air visibility measurements for Denver, Colorado. The acceptable visibility…
A: There is no trend in the data. The naïve forecast method, exponential smoothing or the simple moving…
Q: Arnold Tofu owns and operates a chain of 12 vegetable protein “hamburger” restaurants in northern…
A: SOLUTION: AS PER GIVEN IN THE QUESTION:
Q: A police station had to deploy a police officer for an emergency multiple times in the last four…
A: Moving Average Method: Moving average is an uncomplicated, technical examination method. Moving…
Q: Room registrations in the Toronto Towers Plaza Hotel have been recorded for the past 9 years. To…
A: Solution The regression equation is given by…
Q: . Two servers in a restaurant predict how many guests will come for dinner in the nextfour days. The…
A: server 1 server 2 actual forecast error 1 square error 1 absolute error 1 forecast error 2 square…
Q: b) If the check-processing center received 45 million checks in the month of July, then using…
A: Forecasting is the process of predicting the future demand or sales of customers based on previous…
Q: A police station had to deploy a police officer for an emergency multiple times in the last four…
A: A moving average is a method for determining the overall trends in a data collection by taking the…
Q: Attendance at Orlando's newest Disneylike attraction, Lego World, has been as follows: Guests Guests…
A: Quarter Year 1 Year 2 Year 3 Average Winter 58 65 99 74 (i.e. 58+65+993) Spring 94 82 156…
Q: The Charbondale Hospital is considering the purchase of a new ambulance. The decision will rest…
A: Forecast for 2013 = 3799
Q: Using simple linear regression and given that the price per cup is $1.85, the forecasted demand for…
A: The price and quantities sold for mocha latter coffee is given, now the demand has to be forecasted…
Q: 1. Which of the following exactly defines continuous processes? - Continuous processes are able to…
A: “Since you have asked multiple questions, we will solve the first question for you. If you want any…
Q: A retail shopping chain decided to improve its customer service, productivity and reduce its…
A: Note: Since you have posted multiple independent questions in the same request, we will solve the…
Q: General Motors would like an estimate of the chance that Tesla will bring the cost of batteries down…
A: The contingency plans and scenarios are the means for anticipating future conditions. Contingency…
Q: The number of major plumbing repair jobs performed by Augur’s Plumbing Service in each of the last…
A: Three-point averages are calculated by taking a number in the series with the previous and next…
Q: If the demand in the current week was 102 units and we had forecast it to be 125, what would be next…
A: Exponential smoothing is a time series forecasting technique that forecasts data for a given period…
Q: a. Develop a regression equation to forecast the cost per thousand gallons as a function of the…
A: In statistics, a regression equation is used to determine whether or not there is a link between two…
Q: Which one of the following models would be best for new product forecasting? Multiple Choice…
A: Holt's two-parameter model, also called as linear exponential smoothing, is a popular smoothing…
Q: Attendance at Orlando's newest Disneylike attraction, Lego World, has been as follows: Guests (in…
A: Seasonal indices identify the seasonal variations and helps to forecast upcoming years based while…
Q: a. Use linear regression to find a relation to forecast Y, which is the quality parameter from the…
A: The Equation of Linear Regression, The equation is Y= a + b*X, where Y is the dependent variable…
Q: In order to predict pancakes, John's House of Pancakes uses a weighted moveable average process. It…
A: Given that; Weight for July = 5 Weight for June = 3 Weight for May = 1 Revenue in May = 1000…


Trending now
This is a popular solution!

Step by step
Solved in 2 steps with 6 images

- Suppose that a regional express delivery service company wants to estimate the cost of shipping a package (Y) as a function of cargo type, where cargo type includes the following possibilities: fragile, semifragile, and durable. Costs for 15 randomly chosen packages of approximately the same weight and same distance shipped, but of different cargo types, are provided in the file P13_16.xlsx. a. Estimate a regression equation using the given sample data, and interpret the estimated regression coefficients. b. According to the estimated regression equation, which cargo type is the most costly to ship? Which cargo type is the least costly to ship? c. How well does the estimated equation fit the given sample data? How might the fit be improved? d. Given the estimated regression equation, predict the cost of shipping a package with semifragile cargo.The Baker Company wants to develop a budget to predict how overhead costs vary with activity levels. Management is trying to decide whether direct labor hours (DLH) or units produced is the better measure of activity for the firm. Monthly data for the preceding 24 months appear in the file P13_40.xlsx. Use regression analysis to determine which measure, DLH or Units (or both), should be used for the budget. How would the regression equation be used to obtain the budget for the firms overhead costs?The owner of a restaurant in Bloomington, Indiana, has recorded sales data for the past 19 years. He has also recorded data on potentially relevant variables. The data are listed in the file P13_17.xlsx. a. Estimate a simple regression equation involving annual sales (the dependent variable) and the size of the population residing within 10 miles of the restaurant (the explanatory variable). Interpret R-square for this regression. b. Add another explanatory variableannual advertising expendituresto the regression equation in part a. Estimate and interpret this expanded equation. How does the R-square value for this multiple regression equation compare to that of the simple regression equation estimated in part a? Explain any difference between the two R-square values. How can you use the adjusted R-squares for a comparison of the two equations? c. Add one more explanatory variable to the multiple regression equation estimated in part b. In particular, estimate and interpret the coefficients of a multiple regression equation that includes the previous years advertising expenditure. How does the inclusion of this third explanatory variable affect the R-square, compared to the corresponding values for the equation of part b? Explain any changes in this value. What does the adjusted R-square for the new equation tell you?
- The management of a technology company is trying to determine the variable that best explains the variation of employee salaries using a sample of 52 full-time employees; see the file P13_08.xlsx. Estimate simple linear regression equations to identify which of the following has the strongest linear relationship with annual salary: the employees gender, age, number of years of relevant work experience prior to employment at the company, number of years of employment at the company, or number of years of post secondary education. Provide support for your conclusion.A small computer chip manufacturer wants to forecast monthly ozperating costs as a function of the number of units produced during a month. The company has collected the 16 months of data in the file P13_34.xlsx. a. Determine an equation that can be used to predict monthly production costs from units produced. Are there any outliers? b. How could the regression line obtained in part a be used to determine whether the company was efficient or inefficient during any particular month?Stock market analysts are continually looking for reliable predictors of stock prices. Consider the problem of modeling the price per share of electric utility stocks (Y). Two variables thought to influence this stock price are return on average equity (X1) and annual dividend rate (X2). The stock price, returns on equity, and dividend rates on a randomly selected day for 16 electric utility stocks are provided in the file P13_15.xlsx. Estimate a multiple regression equation using the given data. Interpret each of the estimated regression coefficients. Also, interpret the standard error of estimate and the R-square value for these data.
- Do the sales prices of houses in a given community vary systematically with their sizes (as measured in square feet)? Answer this question by estimating a simple regression equation where the sales price of the house is the dependent variable, and the size of the house is the explanatory variable. Use the sample data given in P13_06.xlsx. Interpret your estimated equation, the associated R-square value, and the associated standard error of estimate.A trucking company wants to predict the yearly maintenance expense (Y) for a truck using the number of miles driven during the year (X1) and the age of the truck (X2, in years) at the beginning of the year. The company has gathered the data given in the file P13_13.xlsx. Note that each observation corresponds to a particular truck. Estimate a multiple regression equation using the given data. Interpret each of the estimated regression coefficients. Also, interpret the standard error of estimate and the R-square value for these data.An antique collector believes that the price received for a particular item increases with its age and with the number of bidders. The file P13_14.xlsx contains data on these three variables for 32 recently auctioned comparable items. Estimate a multiple regression equation using the given data. Interpret each of the estimated regression coefficients. Is the antique collector correct in believing that the price received for the item increases with its age and with the number of bidders? Interpret the standard error of estimate and the R-square value for these data.
- The file P13_29.xlsx contains monthly time series data for total U.S. retail sales of building materials (which includes retail sales of building materials, hardware and garden supply stores, and mobile home dealers). a. Is seasonality present in these data? If so, characterize the seasonality pattern. b. Use Winters method to forecast this series with smoothing constants = = 0.1 and = 0.3. Does the forecast series seem to track the seasonal pattern well? What are your forecasts for the next 12 months?Management of a home appliance store would like to understand the growth pattern of the monthly sales of Blu-ray disc players over the past two years. Managers have recorded the relevant data in the file P13_33.xlsx. a. Create a scatterplot for these data. Comment on the observed behavior of monthly sales at this store over time. b. Estimate an appropriate regression equation to explain the variation of monthly sales over the given time period. Interpret the estimated regression coefficients. c. Analyze the estimated equations residuals. Do they suggest that the regression equation is adequate? If not, return to part b and revise your equation. Continue to revise the equation until the results are satisfactory.The file P13_28.xlsx contains monthly retail sales of U.S. liquor stores. a. Is seasonality present in these data? If so, characterize the seasonality pattern. b. Use Winters method to forecast this series with smoothing constants = = 0.1 and = 0.3. Does the forecast series seem to track the seasonal pattern well? What are your forecasts for the next 12 months?