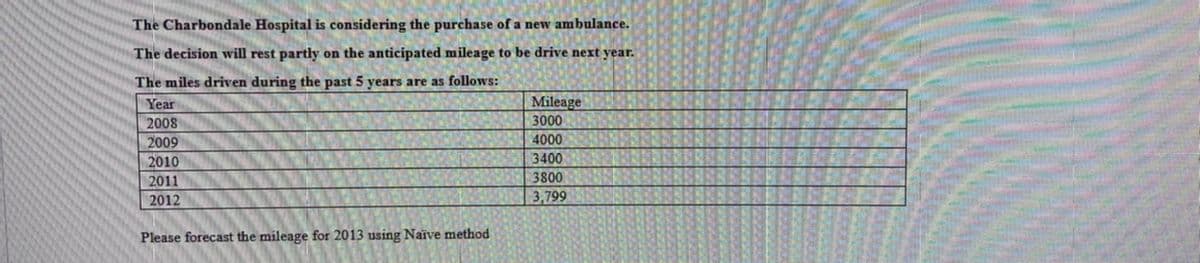
The Charbondale Hospital is considering the purchase of a new ambulance. The decision will rest partly on the anticipated mileage to be drive next year. The miles driven during the past 5 years are as follows: Mileage 3000 Year 2008 2009 4000 2010 3400 3800 2011 2012 3,799 Please forecast the mileage for 2013 using Naive method


Q: A manufacturing firm has developed a skills test, the scores from which can be used to predict…
A:
Q: A police station had to deploy a police officer for an emergency multiple times in the last four…
A: The technique of Naïve forecasting is when the previous period's sales are utilized to anticipate…
Q: Data collected on the yearly registrations for a Six Sigma seminar at the Quality College are shown…
A: Formula used- 3-period moving average forecast=At-1+At-2+At-33 3-period weighted moving average…
Q: The following gives the number of accidents that occurred on Florida State Highway 101 during the…
A: Given data - Month January February March April No. of Accidents 30 40 60 95
Q: a) b) would have applied the Naïve Model, calculate the Naïve Forecast values for the months of…
A: Answers of all parts is below:-
Q: Auniversity lecturer needs to allocate time next week to include time for office hours. He needs to…
A: Exponential smoothing is a time series forecasting method. It calculates a weighted average of past…
Q: The number of internal disk drives (in millions) made at a plant in Taiwan during the past 5 years…
A: Find the Given details below: Given Details: Year Disk Drives 1 138 2 156 3 184 4 202…
Q: Select the most suitable forecasting technique (survey, Delphi, averaging seasonal, naive, trend, or…
A: Forecasting may be a technique that uses historical knowledge as inputs to form educated estimates…
Q: The president of the Southern University wants to forecast student enrolments for this academic year…
A: Given data
Q: The manager of the Salem police department motor poolwants to develop a forecast model for annual…
A: a) The regression equation can be determined using excel as follows: Step 1: Put the data onto the…
Q: Lori Cook has developed the following forecasting model: ^y=45.0+4.20x,…
A: Using the given Forecasting model the forecast for air conditioner at various level of temperature…
Q: The monthly sales for Yazici Batteries, Inc., were as follows: Month Sales Jan Feb Mar 19 21 17 Apr…
A: Find the Given details below: Given details: Month Sales January 19 February 21 March 17…
Q: Exercise # 2 –Calculating MADt, Revised MADt,Error,and the Revised Error :Has the Forecast Improved…
A: 2 period moving average forecast for revising: -
Q: a) The simple linear regression equation that relates bar sales to number of guests (not to time) is…
A: Below is the solution:-
Q: The Charbondale Hospital is considering the purchase of a new ambulance. The decision will rest…
A: Using the above Formula : Forecast for Year 2009 = forecast of 2008 + 0.3*(actual of 2008 -…
Q: Lori Cook has developed the following forecasting model: y = 45.0 + 4.50x, where y = demand for Kool…
A: Given equation for the forecasting model, y=45+4.50×x y= Demand for Kol air conditioners x=the…
Q: The number of disk drives (in millions) made at a plant in Taiwan during the past 5 years follows:…
A: The forecast of disks to be produced next year can be computed as follows:
Q: The Carbondale Hospital is considering the purchase of a new ambulance. The decision will rest…
A: Demand forecasting is nothing but the approach of making predictions or estimations about the demand…
Q: The number of internal disk drives (in millions) made at a plant in Taiwan during the past 5 years…
A: BELOW IS THE SOLUTION TO THE QUESTION.
Q: Lenovo uses the ZX-81 chip in some of its laptop computers. The prices for the chip during the last…
A:
Q: A police station had to deploy a police officer for an emergency multiple times in the last four…
A: Find the Given details below: Given Details: Weekday Number of calls each day Monday 6…
Q: Arnold Tofu owns and operates a chain of 12 vegetable protein “hamburger” restaurants in northern…
A: SOLUTION: AS PER GIVEN IN THE QUESTION:
Q: A police station had to deploy a police officer for an emergency multiple times in the last four…
A: Forecast for Friday using naive approach = Actual demand of previous period(Thursday) = 12.
Q: Tom Simpson, Director of the Chamber of Commerce for Exeter township is investigating the past ten…
A: A simple moving average (SMA) measures the average of a chosen range of values, normally closing…
Q: A police station had to deploy a police officer for an emergency multiple times in the last four…
A: Moving Average Method: Moving average is an uncomplicated, technical examination method. Moving…
Q: The dean of a school of business is forecasting total student enrollment for this year's summer…
A: For Period t, let the particular enrollment be At and Forecast be Ft For 3 year moving average,-Ft =…
Q: Room registrations in the Toronto Towers Plaza Hotel have been recorded for the past 9 years. To…
A: Solution The regression equation is given by…
Q: . Two servers in a restaurant predict how many guests will come for dinner in the nextfour days. The…
A: server 1 server 2 actual forecast error 1 square error 1 absolute error 1 forecast error 2 square…
Q: Whta is the relationship between the moving average method and exponential smoothing?
A: Forecasting is described as the practice of forecasting future values using historical data, most…
Q: The Charbondale Hospital is considering the purchase of a new ambulance. The decision will rest…
A: Given data- Year Mileage (in 100) 2008 30 2009 40 2010 34 2011 38…
Q: A police station had to deploy a police officer for an emergency multiple times in the last four…
A: A moving average is a method for determining the overall trends in a data collection by taking the…
Q: Which month is the peak month and percentage of annual enplanements does it represent on average?…
A: I am using the 5-period moving average to forecast 2015 monthly data of enplaned passengers.
Q: The following gives the number of accidents thatoccurred on Florida State Highway 101 during the…
A: Given Months Number of Accidents Jan 30 Feb 40 Mar 60 Apr 90
Q: Mark Gershon, owner of a musical instrument distributorship, thinks that demand for guitars may be…
A: M5TV Appearances(X) Demand for Guitars (Y) XY X2 Y2 3 2 6 9 4 3 5 15 9 25 8 6 48 64 36 5 4…
Q: The manager of the Petroco Service Station wants to forecast the demand for unleaded gasoline next…
A: Exponential smoothing is a forecasting methodology that is extensively used to make a reliable…
Q: My App is a small but growing start-up that sees demand for several of its apps increasing quickly.…
A: Month 7 Forecast is 538,210.51
Q: The Charbondale Hospital is considering the purchase of a new ambulance. The decision will rest…
A: Forecast of 2013 = 0.6*demand of 2012 + 0.4* Demand of 2011
Q: The manager of the Carpet City outlet needs to make an accurate forecast of the demand for Soft Shag…
A: Forecasting is very crucial for any business and nowadays businesses are surviving because of…
Q: The following table gives the number of pints of type A blood used at Damascus Hospital in the past…
A: Given data is
Q: Over the past 6 weeks, some overseas wholesalers lowered their exports past 6 weeks shipments…
A: First of all, we have to list down the values in excel sheet
Q: A manufacturing firm has developed a skills test, the scores from which can be used to predict…
A: Find the Given details below: Given details: Worker Test Score Production Rating A 55 43 B…
Q: A retail store records customer demand during each sales period. The data has been collected in the…
A: 3 Period Moving Average Forecasting (Ft) = At-1 +At-2 +At-33 Error = Actual - Forecast Means Squared…
Q: Lenovo uses the ZX-81 chip in some of its laptop computers. The prices for the chip during the last…
A:
Q: The Charbondale Hospital is considering the purchase of a new ambulance. The decision will rest…
A: Error = Actual demand - Forecast Actual of 2012 = 3700 Forecast of 2012 = 3739
Q: A concert promoter is forecasting this year's attendance for one of his concerts based on the…
A: Given values, Year Attendance Four years ago 9,000 Three years ago 16,000 Two years ago…
Q: A chain of pizza stores has had the following sales for take-out food over the last four…
A: Friday forecast using Exponential smoothing with Alpha = 0.20:…
Q: Eurotronics manufactures components for use in small electronic products such as computers, CD…
A: The linear regression forecast is used here because no other data is available. One can also use a…
Q: The equation y = 210 + 3x is used to predict quarterly demand where x = 0 in the second quarter of…
A: Calculating the forecast for the third quarter of the year. We have,Y = 210 + 3xHere,x = Third…
Please


Trending now
This is a popular solution!

Step by step
Solved in 2 steps

- The Baker Company wants to develop a budget to predict how overhead costs vary with activity levels. Management is trying to decide whether direct labor hours (DLH) or units produced is the better measure of activity for the firm. Monthly data for the preceding 24 months appear in the file P13_40.xlsx. Use regression analysis to determine which measure, DLH or Units (or both), should be used for the budget. How would the regression equation be used to obtain the budget for the firms overhead costs?The owner of a restaurant in Bloomington, Indiana, has recorded sales data for the past 19 years. He has also recorded data on potentially relevant variables. The data are listed in the file P13_17.xlsx. a. Estimate a simple regression equation involving annual sales (the dependent variable) and the size of the population residing within 10 miles of the restaurant (the explanatory variable). Interpret R-square for this regression. b. Add another explanatory variableannual advertising expendituresto the regression equation in part a. Estimate and interpret this expanded equation. How does the R-square value for this multiple regression equation compare to that of the simple regression equation estimated in part a? Explain any difference between the two R-square values. How can you use the adjusted R-squares for a comparison of the two equations? c. Add one more explanatory variable to the multiple regression equation estimated in part b. In particular, estimate and interpret the coefficients of a multiple regression equation that includes the previous years advertising expenditure. How does the inclusion of this third explanatory variable affect the R-square, compared to the corresponding values for the equation of part b? Explain any changes in this value. What does the adjusted R-square for the new equation tell you?At the beginning of each week, a machine is in one of four conditions: 1 = excellent; 2 = good; 3 = average; 4 = bad. The weekly revenue earned by a machine in state 1, 2, 3, or 4 is 100, 90, 50, or 10, respectively. After observing the condition of the machine at the beginning of the week, the company has the option, for a cost of 200, of instantaneously replacing the machine with an excellent machine. The quality of the machine deteriorates over time, as shown in the file P10 41.xlsx. Four maintenance policies are under consideration: Policy 1: Never replace a machine. Policy 2: Immediately replace a bad machine. Policy 3: Immediately replace a bad or average machine. Policy 4: Immediately replace a bad, average, or good machine. Simulate each of these policies for 50 weeks (using at least 250 iterations each) to determine the policy that maximizes expected weekly profit. Assume that the machine at the beginning of week 1 is excellent.
- Suppose that a regional express delivery service company wants to estimate the cost of shipping a package (Y) as a function of cargo type, where cargo type includes the following possibilities: fragile, semifragile, and durable. Costs for 15 randomly chosen packages of approximately the same weight and same distance shipped, but of different cargo types, are provided in the file P13_16.xlsx. a. Estimate a regression equation using the given sample data, and interpret the estimated regression coefficients. b. According to the estimated regression equation, which cargo type is the most costly to ship? Which cargo type is the least costly to ship? c. How well does the estimated equation fit the given sample data? How might the fit be improved? d. Given the estimated regression equation, predict the cost of shipping a package with semifragile cargo.It costs a pharmaceutical company 75,000 to produce a 1000-pound batch of a drug. The average yield from a batch is unknown but the best case is 90% yield (that is, 900 pounds of good drug will be produced), the most likely case is 85% yield, and the worst case is 70% yield. The annual demand for the drug is unknown, with the best case being 20,000 pounds, the most likely case 17,500 pounds, and the worst case 10,000 pounds. The drug sells for 125 per pound and leftover amounts of the drug can be sold for 30 per pound. To maximize annual expected profit, how many batches of the drug should the company produce? You can assume that it will produce the batches only once, before demand for the drug is known.The file P13_02.xlsx contains five years of monthly data on sales (number of units sold) for a particular company. The company suspects that except for random noise, its sales are growing by a constant percentage each month and will continue to do so for at least the near future. a. Explain briefly whether the plot of the series visually supports the companys suspicion. b. By what percentage are sales increasing each month? c. What is the MAPE for the forecast model in part b? In words, what does it measure? Considering its magnitude, does the model seem to be doing a good job? d. In words, how does the model make forecasts for future months? Specifically, given the forecast value for the last month in the data set, what simple arithmetic could you use to obtain forecasts for the next few months?
- Play Things is developing a new Lady Gaga doll. The company has made the following assumptions: The doll will sell for a random number of years from 1 to 10. Each of these 10 possibilities is equally likely. At the beginning of year 1, the potential market for the doll is two million. The potential market grows by an average of 4% per year. The company is 95% sure that the growth in the potential market during any year will be between 2.5% and 5.5%. It uses a normal distribution to model this. The company believes its share of the potential market during year 1 will be at worst 30%, most likely 50%, and at best 60%. It uses a triangular distribution to model this. The variable cost of producing a doll during year 1 has a triangular distribution with parameters 15, 17, and 20. The current selling price is 45. Each year, the variable cost of producing the doll will increase by an amount that is triangularly distributed with parameters 2.5%, 3%, and 3.5%. You can assume that once this change is generated, it will be the same for each year. You can also assume that the company will change its selling price by the same percentage each year. The fixed cost of developing the doll (which is incurred right away, at time 0) has a triangular distribution with parameters 5 million, 7.5 million, and 12 million. Right now there is one competitor in the market. During each year that begins with four or fewer competitors, there is a 25% chance that a new competitor will enter the market. Year t sales (for t 1) are determined as follows. Suppose that at the end of year t 1, n competitors are present (including Play Things). Then during year t, a fraction 0.9 0.1n of the company's loyal customers (last year's purchasers) will buy a doll from Play Things this year, and a fraction 0.2 0.04n of customers currently in the market ho did not purchase a doll last year will purchase a doll from Play Things this year. Adding these two provides the mean sales for this year. Then the actual sales this year is normally distributed with this mean and standard deviation equal to 7.5% of the mean. a. Use @RISK to estimate the expected NPV of this project. b. Use the percentiles in @ RISKs output to find an interval such that you are 95% certain that the companys actual NPV will be within this interval.The file P13_22.xlsx contains total monthly U.S. retail sales data. While holding out the final six months of observations for validation purposes, use the method of moving averages with a carefully chosen span to forecast U.S. retail sales in the next year. Comment on the performance of your model. What makes this time series more challenging to forecast?The management of a technology company is trying to determine the variable that best explains the variation of employee salaries using a sample of 52 full-time employees; see the file P13_08.xlsx. Estimate simple linear regression equations to identify which of the following has the strongest linear relationship with annual salary: the employees gender, age, number of years of relevant work experience prior to employment at the company, number of years of employment at the company, or number of years of post secondary education. Provide support for your conclusion.
- The file P13_42.xlsx contains monthly data on consumer revolving credit (in millions of dollars) through credit unions. a. Use these data to forecast consumer revolving credit through credit unions for the next 12 months. Do it in two ways. First, fit an exponential trend to the series. Second, use Holts method with optimized smoothing constants. b. Which of these two methods appears to provide the best forecasts? Answer by comparing their MAPE values.The file P13_29.xlsx contains monthly time series data for total U.S. retail sales of building materials (which includes retail sales of building materials, hardware and garden supply stores, and mobile home dealers). a. Is seasonality present in these data? If so, characterize the seasonality pattern. b. Use Winters method to forecast this series with smoothing constants = = 0.1 and = 0.3. Does the forecast series seem to track the seasonal pattern well? What are your forecasts for the next 12 months?

