a- Write down the economic function for the above estimation by using the information obtained from above table b- Write down the economic model for the above estimation by using the information obtained from above table
a- Write down the economic function for the above estimation by using the information obtained from above table b- Write down the economic model for the above estimation by using the information obtained from above table

Chapter1: Making Economics Decisions
Section: Chapter Questions
Problem 1QTC

Related questions
Question
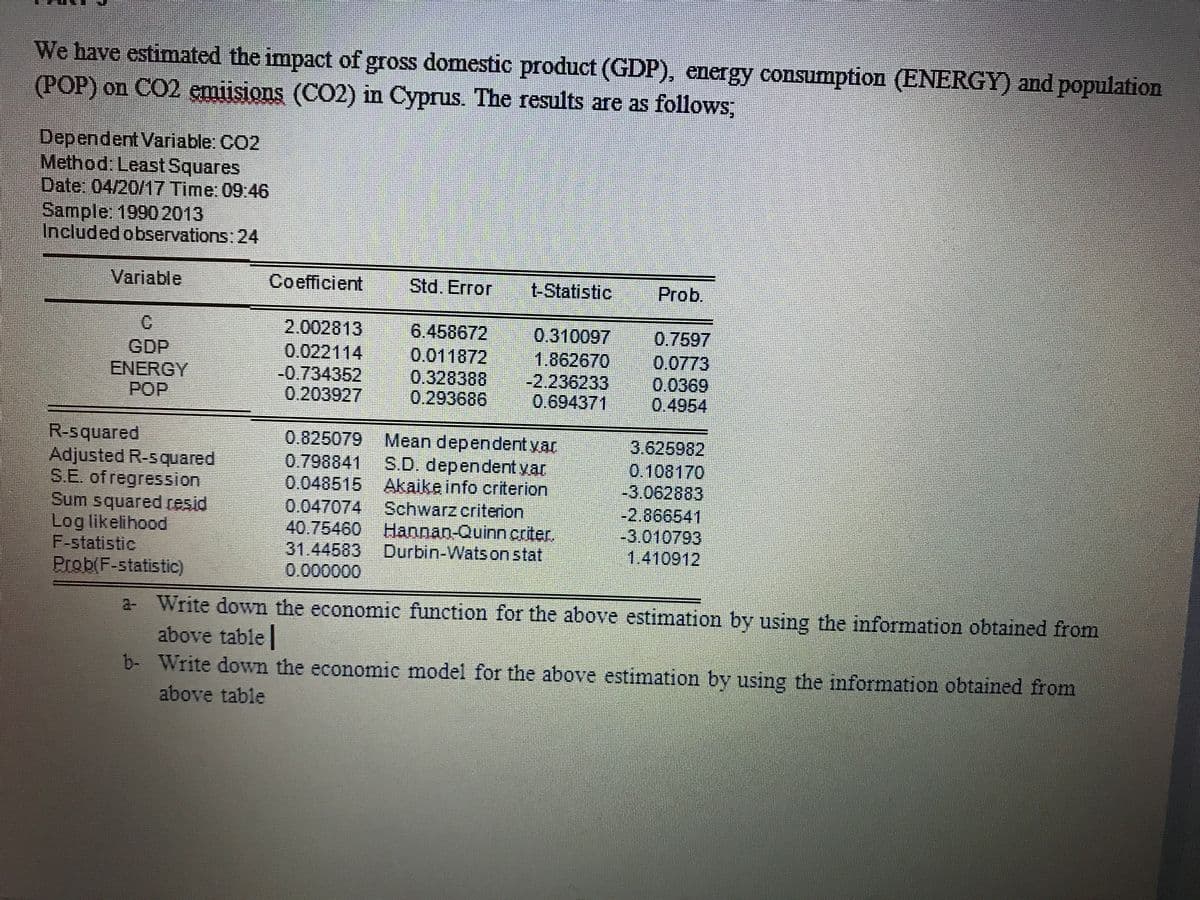
Transcribed Image Text:We have estimated the impact of gross domestic product (GDP), energy consumption (ENERGY) and population
(POP) on CO2 emiisions (CO2) in Cyprus. The results are as follows,
Dependent Variable: CO2
Method: Least Squares
Date: 04/20/17 Time: 09.46
Sample: 1990 2013
Included observations: 24
Variable
Coefficient
Std. Error
t-Statistic
Prob.
GDP
ENERGY
POP
2.002813
0.022114
-0.734352
0.203927
6.458672
0.011872
0.328388
0.293686
0,310097
1.862670
-2.236233
0.694371
0.7597
0.0773
0,0369
0.4954
R-squared
Adjusted R-squared
S.E. of regression
Sum squared resid
Log likelihood
F-statistic
Prob(F-statistic)
0.825079 Mean dependentyar
0.798841
0.048515 Akaike info criterion
0.047074 Schwarz criterion
40.75460 Hannan-Quinn.criter.
31.44583 Durbin-Wats on stat
0.000000
3.625982
0.108170
-3.062883
-2.866541
-3.010793
1.410912
S.D. dependent yar
a Write down the economie function for the above estimation by using the information obtained from
above table|
b- Write down the economic model for the above estimation by using the information obtained from
above table
Expert Solution
This question has been solved!
Explore an expertly crafted, step-by-step solution for a thorough understanding of key concepts.

Step by step
Solved in 3 steps

Knowledge Booster


Learn more about
Need a deep-dive on the concept behind this application? Look no further. Learn more about this topic, economics and related others by exploring similar questions and additional content below.Recommended textbooks for you

Principles of Economics (12th Edition)
Economics
ISBN:
9780134078779
Author:
Karl E. Case, Ray C. Fair, Sharon E. Oster
Publisher:
PEARSON

Engineering Economy (17th Edition)
Economics
ISBN:
9780134870069
Author:
William G. Sullivan, Elin M. Wicks, C. Patrick Koelling
Publisher:
PEARSON
Principles of Economics (12th Edition)
Economics
ISBN:
9780134078779
Author:
Karl E. Case, Ray C. Fair, Sharon E. Oster
Publisher:
PEARSON
Engineering Economy (17th Edition)
Economics
ISBN:
9780134870069
Author:
William G. Sullivan, Elin M. Wicks, C. Patrick Koelling
Publisher:
PEARSON

Principles of Economics (MindTap Course List)
Economics
ISBN:
9781305585126
Author:
N. Gregory Mankiw
Publisher:
Cengage Learning

Managerial Economics: A Problem Solving Approach
Economics
ISBN:
9781337106665
Author:
Luke M. Froeb, Brian T. McCann, Michael R. Ward, Mike Shor
Publisher:
Cengage Learning

Managerial Economics & Business Strategy (Mcgraw-…
Economics
ISBN:
9781259290619
Author:
Michael Baye, Jeff Prince
Publisher:
McGraw-Hill Education